FIX Latency Tool
December 2025 Update: We made new alternative tool available - eBPF based latency tracer.
Overview
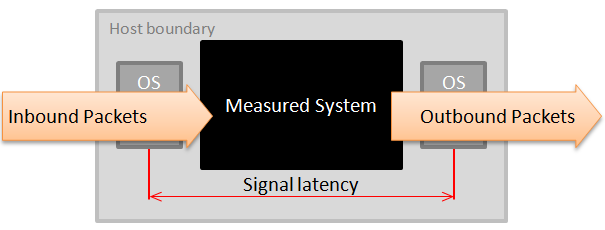
The FIX Latency Tool is a utility for real-time monitoring of latency between sent and received FIX messages with minimal resource usage. It is an interactive command-line application that outputs information to the console, is controlled by hotkeys, and can also write recorded data to files in several formats. Additionally, it can transmit latency histogram information to a different process via a memory-mapped file. However, it is important to note that the application expects a TCP/IP packet stream without losses and retransmissions, otherwise, the measurements may be incorrect, and warnings or errors will be displayed.
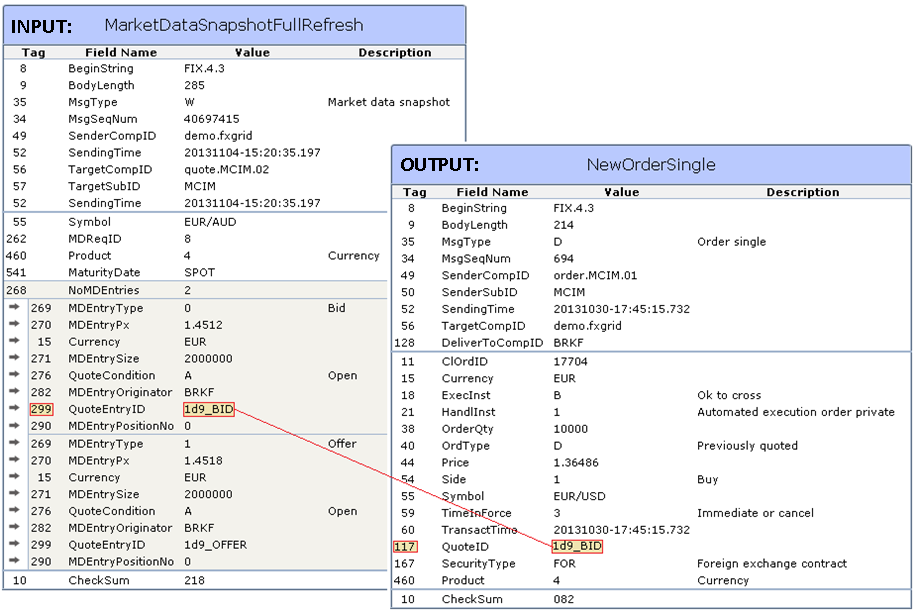
 For example, this tool can be used measure latency of trading signals. FX market data feed usually contain a field QuoteEntryID(299), while FX orders may contain a field QuoteID(117). Tool can correlate inbound and outbound messages based on the value provided in these tags. Tool can collect statistics for hundred of thousands of these tick-to-order signals and build latency histogram.
Download
You can download the latest version of the FIX Latency Tool from here:
Installation
Linux
Libcap Version
Before installing the application, ensure that you have libpcap installed on your system.
The installation process differs depending on your Linux distribution:
- Alpine Linux:
apk add libpcap libstdc++ - RHEL/CentOS:
yum -y install libpcaporyum -y --enablerepo=powertools install libpcap-devel - Ubuntu:
sudo apt-get -y install libpcap-dev - Mac OS (with Homebrew):
brew install libpcap
Please note that the pre-built application may reference a different version of libpcap from the one installed on your system. If you see an error like ./latency-tool: error while loading shared libraries: libpcap.so.0.8, you may need to create a symbolic link to the actual installed version as a workaround.
For example, on CentOS with libpcap version 1.5.3, you can use one of the following examples:
sudo ln -s /usr/lib64/libpcap.so.1.5.3 /usr/lib64/libpcap.so.0.8sudo ln -s /usr/lib64/libpcap.so.1.5.3 ./libpcap.so.0.8
On Ubuntu 22 you can use:
sudo sudo ln -s /usr/lib/x86_64-linux-gnu/libpcap.so.1.10.1 /usr/lib/x86_64-linux-gnu/libpcap.so.1
Real-time Monitoring
For real-time monitoring, the FIX Latecy Tools requires superuser privileges, for which you can use sudo or su. Otherwise, network devices will not be seen and only offline analysis is possible.
Windows
To use the FIX Latency Tool on Windows, follow these steps:
Prerequisites
You must have winpcap installed on your system.
Application Files
The FIX Latency Tool application is distributed as a zip archive consisting of two files: latency-tool.exe and LogSender.dll. Make sure that LogSender.dll resides in the same location as the application.
Display Help and List Network Devices
To display help, open the command prompt and run: latency-tool -h.
To list network devices, use the following command: latency-tool --list.
Verifying Real-time Operation
To monitor the first network device on your system until the first matching packet going to port 80, use one of the following commands:
- On Windows:
latency-tool --device=1 --remote-port=80 -f=*:1 -t=*:1. - On Linux:
sudo ./latency-tool --device=1 --remote-port=80 -f=*:1 -t=*:1.
If the first device is not connected to the network, use another device index obtained via --list.
If the application is working correctly, the packet counter will roll, and the app will soon finish with an error message like: ERROR: Packet 20 matches both IN and OUT filters!.
Configuration: Command Line Arguments
The FIX Latency Tool can be used to capture packets in real-time or to process existing pcap files. Command-line arguments are used to set the capture device and specify what packets will be matched. The minimum configuration should specify the capture device or file, as well as the packet and FIX filters for both IN and OUT directions. All other parameters are optional or already have sane default values.
Basic Options
The Latency Tool supports various command-line arguments to configure its behavior.
Here are the basic options:
| Argument | Description |
|---|---|
--help or -h | Print command-line options help. |
--list | List available packet capture devices. |
--device=X | Specify the device to monitor. You can use any substring of its name or description or use the integer index from the list, starting from 1. |
pcap_filename | Specify a pcap file for offline processing. This argument is ignored if the --device argument is also present. |
--buffer=N | Set the size of the preallocated message matching buffer. The buffer's size determines the maximum number of entries from the IN filter that will be remembered. Keep in mind that a larger buffer uses more memory and may be slightly slower. Each entry in the buffer takes 16 bytes of RAM. |
--window=N | Set the size of the moving window. This determines the number of entries used for calculating real-time statistics over a rolling window. |
Packet Capture Options
The Latency Tool provides packet capture options with default parameters optimized for best performance on most systems. It is advisable to keep these parameters at their default values as they are already tuned for the best performance on most systems.
Here are the available packet capture options:
| Argument | Description | Default Value |
|---|---|---|
--pcap-buffer=NBytes | Set the size of the pcap capture buffer. | 4 MiB |
--pcap-batch or -pb =N | Set the pcap message batch size. | 256 |
--pcap-mode=N | Do not change. This parameter is already set to 2 by default. | 2 |
--pcap-timeout=M | Set the pcap packet request call timeout. | 2 ms |
--pcap-replay-rate=N | Set the pcap offline file replay rate, in Hz. Use this option to make the application behave like it is analyzing real-time data instead of processing the file almost instantly. |
Filtering
The Latency Tool offers a set of command-line arguments to control the matching of messages and message fields. Two identical sets of filtering parameters are available for IN and OUT directions. The matching occurs when the 'correlation id' produced by the OUT filter matches a previously encountered 'correlation id' from the IN filter.
If a packet contains more than one FIX message, all FIX messages are independently matched. If a FIX message is split between adjacent packets, the application attempts to assemble it before starting to analyse its contents. The timestamp is taken from the last fragment containing the message.
Here are the available filtering options:
| Argument | Description |
|---|---|
--filter=X | Common live pcap filter string (optional). A pcap filter that is applied to all packets before they are delivered to the application. It is not recommended to use this option, as it appears to provide no performance improvements. |
--input-filter or --in-filter or -i ="X" | Pcap filter string for the IN direction. Use this option to filter by source or destination (or both) on the IP layer. |
--output-filter or --out-filter or -o ="X" | Pcap filter string for the OUT direction. Use this option to filter by source or destination (or both) on the IP layer. |
--in-src-port=N | TCP source port for the IN direction (default=*). |
--in-dst-port=N | TCP destination port for the IN direction (default=*). |
--out-src-port=N | TCP source port for the OUT direction (default=*). |
--out-dst-port=N | TCP destination port for the OUT direction (default=*). |
--remote-port=N | Same as --in-dst-port=N --out-src-port=N. |
--local-port=N | Same as --in-src-port=N --out-dst-port=N. |
--input-tag-filter or -f =X:Y | IN FIX message/tag filter (see below). |
--output-tag-filter or -t =X:Y | OUT FIX message/tag filter (see below). |
FIX Message/Tag Filter Format
The FIX message/tag filter format allows users to specify how to match and filter FIX messages and their corresponding tags. The format follows a specific structure:
| Filter | Description |
|---|---|
<filter> ::= <type> : <optional-repeating-tag-flag> <integer-tag-number> <optional-character-range> | |
<type> ::= <any-message-type> | <fix-type-list> | |
<any-message-type> ::= * | Match any FIX message type. |
<fix-type-list> ::= <uppercase-character> | <uppercase-character> <fix-type-list> | Possible values for FIX tag 35 (1..n uppercase characters). |
<optional-repeating-tag-flag> ::= n | Match more than 1 occurrence of this tag. |
<optional-character-range> ::= [ <character-index> .. <character-index> ] | [ <character-index> ..] |
Here are some examples of using the message/tag filters:
| Filter | Description |
|---|---|
*:11 | Matches the 1st occurrence of tag 11 from any message. |
D:117[0..7] | Matches the first 8 characters from the 1st occurrence of tag 117 of messages with 32=D (New Order - Single). |
WX:n278[2.. | Matches all but the first 2 characters from all occurrences of tag 278 in all Full Refresh or Incremental Refresh market data messages. |
Files
The following options allow you to specify how the application outputs and saves data to files:
| Argument | Description |
|---|---|
--csv=FILENAME | Outputs percentiles to a CSV file in the specified format. |
--hdr=FILENAME | Outputs percentiles to a file in classic HDR Histogram format. |
--shared-stats=FILENAME | Outputs the histogram to a file, using shared memory on Linux and a plain file on Windows. |
--csv-format=FMT | CSV file format specification. If one character is provided, it specifies the value separator. If two characters are provided, they specify the decimal separator and the value separator. Alphanumeric characters are ignored, allowing users to specify formats like 123,45;67 for readability. Note that ';' is a special character in Unix shell, so use --csv-format=\; to set ';' as the value separator. |
Real-time Display Control
The following options control how often the application updates and scrolls the real-time statistics displayed on the screen:
| Argument | Description |
|---|---|
--stat-period=M | Realtime stat inline update period, in milliseconds. The application updates the statistics displayed on the screen every M milliseconds. The default period is 33ms. |
--scroll-period=M | Realtime stat scroll period, in milliseconds. The application scrolls the statistics on the screen every M milliseconds. |
CPU Affinity
| Argument | Description | Formatting options |
|---|---|---|
--pcap-affinity=CPU_AFFINITY_LIST | CPU affinity list for the capture thread. Specifies the CPU indices that the capture thread should be assigned to, allowing you to control which CPU cores are used for packet capture. | Comma-separated list of 0-based integer CPU indices or range of indices using the - symbol.Examples: 3, 2,4,6, 0-1,4-7. |
--ui-affinity=CPU_AFFINITY_LIST | CPU affinity list for the UI thread. Specifies the CPU indices that the UI thread should be assigned to, allowing you to control which CPU cores are used for the user interface. | Comma-separated list of 0-based integer CPU indices or range of indices using the - symbol.Examples: 3, 2,4,6, 0-1,4-7. |
Other/Debug
These options are not actively maintained and may be broken. Use at your own risk.
| Argument | Description |
|---|---|
--profile | Activate internal performance profiler. |
--rec=FILENAME | Record captured data to a pcap file. |
--play=FILENAME | Attempt to replay an offline file in real time. |
Remarks
- Arguments specified as
Ncan useK,M,Gsuffixes (e.g.,1024K). - Arguments specified as
Mcan usems,s,sec,m,minsuffixes (e.g.,100ms,5min). - Arguments specified as
NBytescan usebytes,b,K,KB,KiB,M,MB,MiBsuffixes (e.g.,1MB,1024KiB).
Real-time Operation
The program's real-time operation can be controlled using several hotkeys while it is running. Upon exiting the application, the histogram will be printed and saved to the specified file.
Currently, the only way to see the histogram without exiting the application or resetting counters is to use --shared-stats command line option.
In case of an unexpected exit, you may need to execute stty sane to restore the Linux console to its normal state.
Hotkeys
Esc- Exits the application.R- Prints the current status, histogram, and reset counters.D- Dumps the window to CSV, histogram, print the current status, and reset counters.Any other key- Prints the current status.
Examples
Example 1: Capture FIX Traffic with Correlation
To capture FIX traffic both coming from and going to IP address 10.0.0.137, use the command provided below:
sudo ./latency-tool --device=3 \
  --input-filter="src host 10.0.0.137" --in-src-port=12000 --input-tag-filter=*:278 \
 --output-filter="dst host 10.0.0.137" --out-dst-port=14000 --output-tag-filter=*:117 \
 --pcap-affinity=9 --ui-affinity=0,1 \
 --window=10000 --stat-period=5000 --scroll-period=5000 --hdr=percentiles.hdr
This will capture traffic from port 12000 to port 14000 and use tags 278 and 117 to correlate inbound and outbound messages.
Example 2: Match Tag 11 (ClOrdId) for FIX Messages
To match Tag 11 (ClOrdId) between a New Order Single going to remote port 11000 and an Execution Report returning from the same port, you can use the following command:
sudo ./latency-tool --device=1 --remote-port=11000 -f=D:11 -t=8:11
You can achieve the same result with a longer version of the command:
sudo ./latency-tool --device=1 \
--in-dst-port=11000 --input-tag-filter=D:11 \
--out-src-port=11000 --output-tag-filter=8:11
Credits
Latency Tool was designed and implemented by Deltix developer Barys Chupryn.
References
You can find the original Java version with some of original documentation here.