order-debugger
Overview
The Order State Debugger is a tool that is part of the Ember diagnostic tools. It is designed to troubleshoot order transitions recorded in a system journal. The tool works by replaying journal messages from the beginning and applying them to orders.
Setup
-
Open a console window with a width of at least 150 characters.
-
Set the
EMBER_HOMEenvironment variable to the location of your Ember home. If you have working files on a fast drive, use theEMBER_WORKenvironment variable to specify the directory containing the journal files (journal.dataandjournal.metadata).set EMBER_HOME=/deltix/emberhome -
Launch the tool:
/opt/deltix/ember/bin/order-debugger
If you want to debug a specific order, enter it as a command-line argument and make sure it is the first order in the chain of replacement orders. For algo orders, you may specify the ID of the parent algo order instead of the child order ID:
/opt/deltix/ember/bin/order-debugger TWAP:31243211
Please note that this tool uses a composite order ID where the order source is used as a prefix (TWAP in the above case).
How it works
Tracing
The Order State Debugger replays recorded journal messages one by one, starting from the very beginning of the journal. For each next message (or for each message related to the order when an order ID is specified) debugger will stop, print data about current order state and hierarchy, and then prompt for the next command. After inspecting the order the user can press ENTER to go to the next order event or request, or type in the number of messages debugger should print out without prompting.
For each order event or request debugger will show the order state after the message is applied. If the order participates in a cancel-replace chain, the tool will trace the messages related to all replacement orders in this chain. The same applies if one of the orders is an algo order that submits child orders. As a result, the tool traces a tree of orders starting from the initial order.
Sample output during tracing:
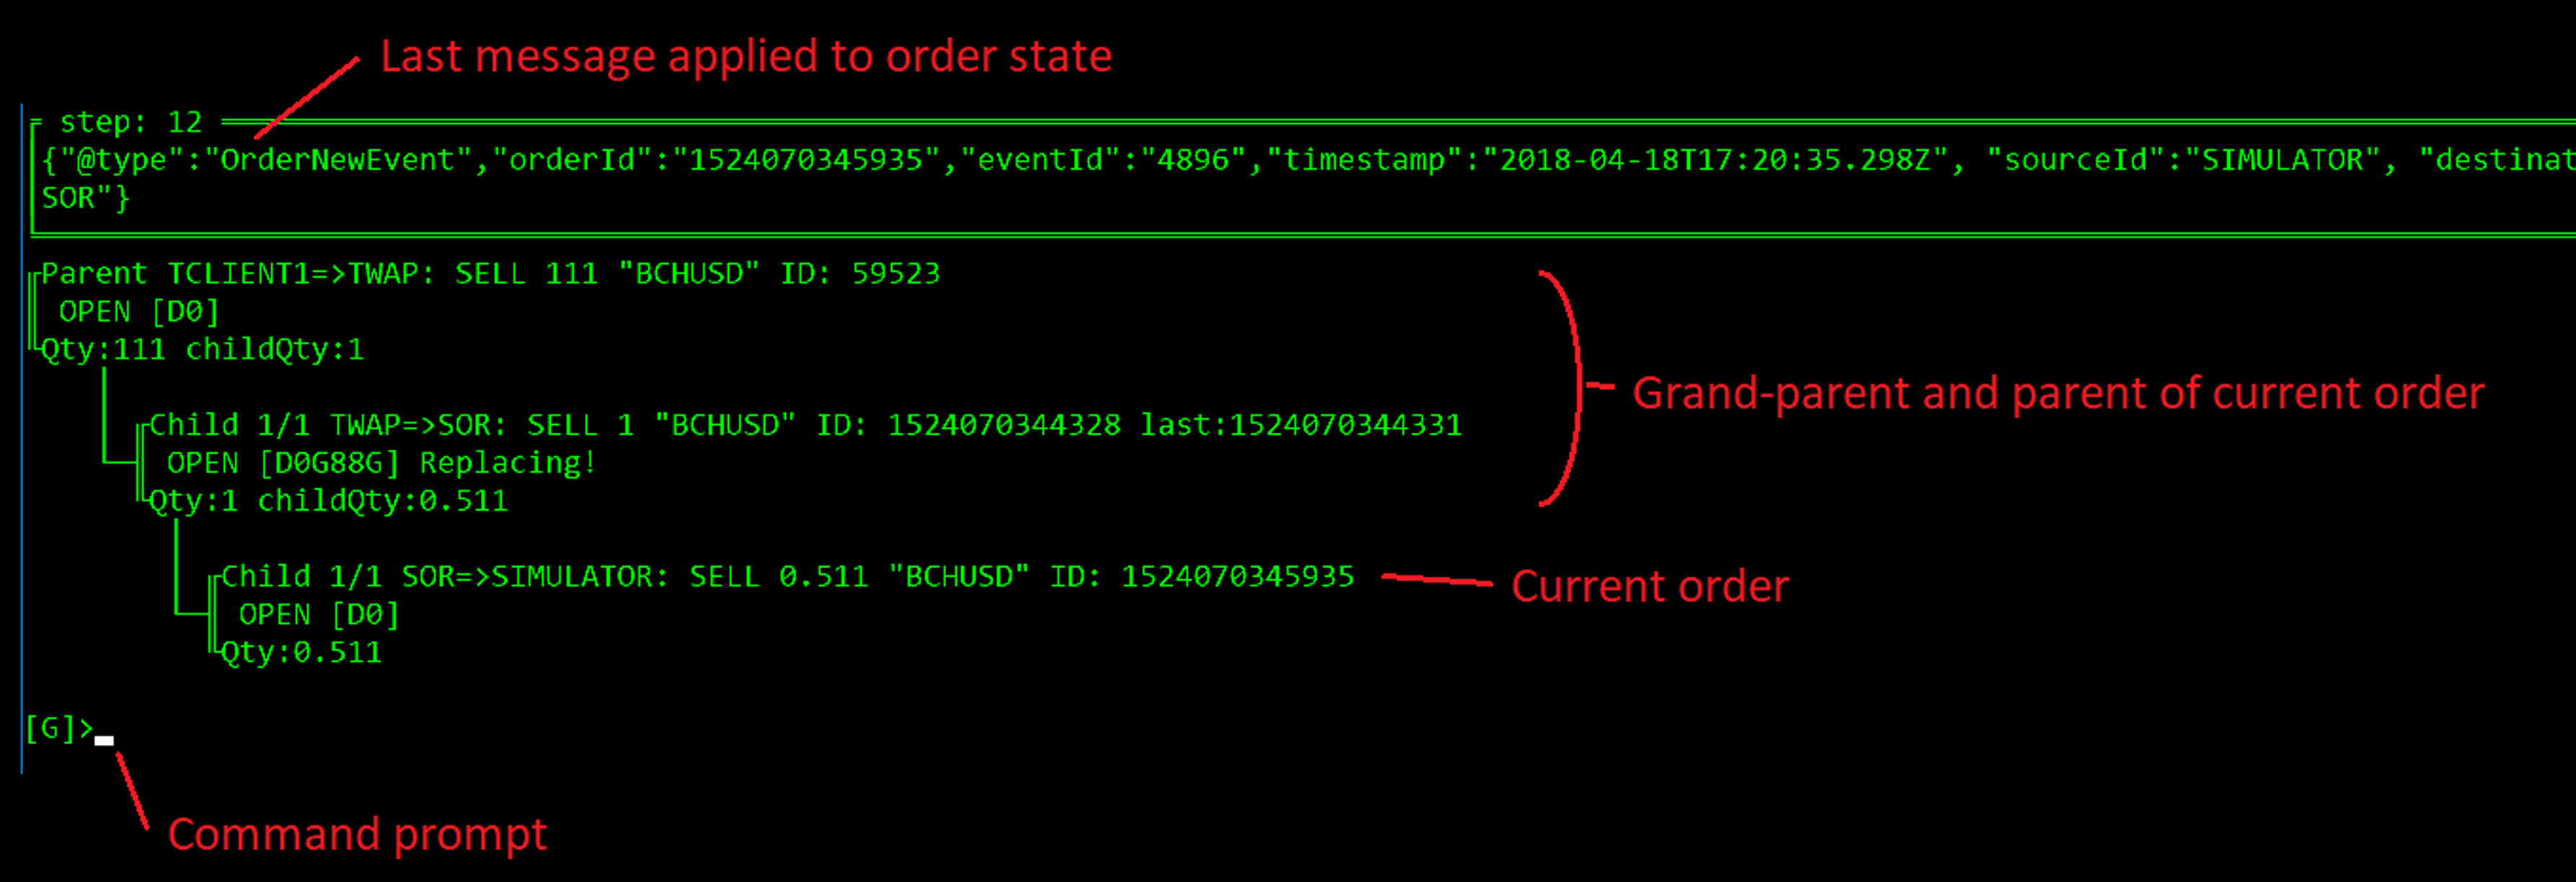
Each order is represented by the following block:
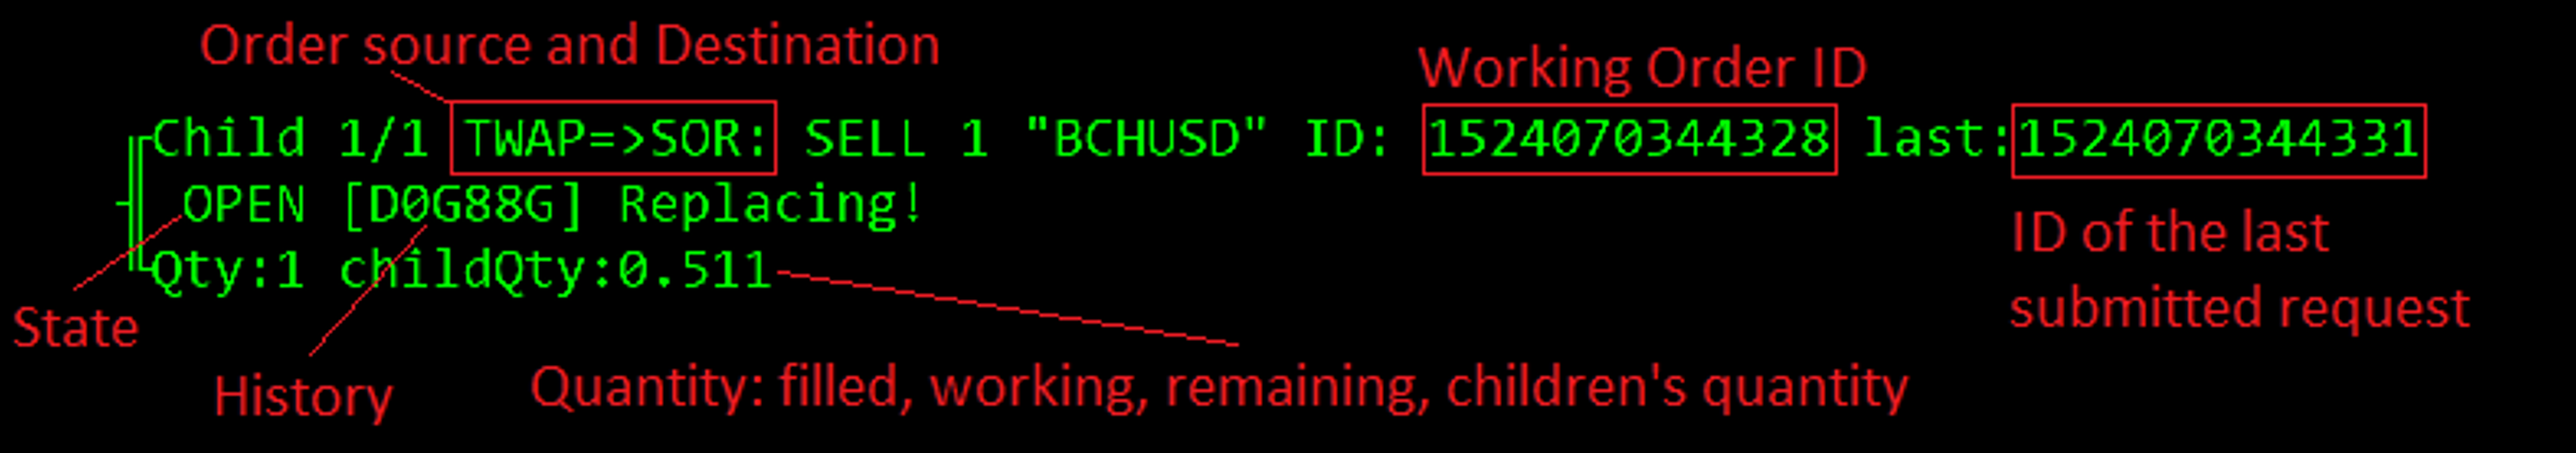
The Order History is represented by a line where each character corresponds to one history record.
Order History is represented by a line where each character is one history record. The following characters represent different events:
| Character | Event |
|---|---|
| D | New Order Request |
| F | Cancel Order Request |
| G | Replace Order Request |
| 0 | Open (New) Order Event |
| a | Pending New Order Event |
| 4 | Cancel Order Event |
| 5 | Order Replace Event |
| 6 | Pending Replace Order Event |
| 8 | Reject Order Event |
| f | Trade (Fill) Event |
| i | Status Event |
Hint: If you are familiar with the FIX Protocol, you may find these resembling tags MsgType(35) and ExecType(150).
You can look up the meaning of history symbols in the debugger by typing in help command:
[G]>help
Enter, G => Go; Q => Quit; <number> => Go n steps forward
History Symbols: D=New F=Cancel G=Modify a=PendingNew 0=New 4=Cancel 5=Replace 6=PendingCancel 8=Reject b=PendingReplace f=Trade i=Status >=Working order marker
Troubleshooting
Can't Find Order
If you can't find your order using the order-debugger, consider the following possibilities:
- Incorrect Order ID: Ensure that you typed the Order ID correctly. Pay attention to the case sensitivity, as (e.g. ember sees it as text, so GUIDs for example may be formatted as lower/upper case).
- Archived Order: If the order is old and has been archived to data warehouse, the
order-debuggermay not be able to locate it in the current journal. - Wrong Environment: Verify that you are running the
order-debuggeron the correct environment. If the order was processed on a different Ember instance, running the tool on another Ember may result in not finding the order. - Journal Replacement: If the Ember Journal was replaced or modified, it may affect the availability of certain orders for debugging.
Keep in mind that the order-debugger is a low-level tool, and its reliability is generally high. Double-check the above points to troubleshoot the issue effectively.
Example of running on host OS
When ember is running under docker compose the following example can be used to run the tool using ember container (you may need to adjust version number and path to EMBER_HOME and EMBER_WORK directories):
docker run --entrypoint "/opt/deltix/ember/bin/order-debugger" -it -v "/home/r8fin/ember/config:/var/lib/emberhome" -v "/home/r8fin/ember/work:/var/lib/emberwork" "registry.deltixhub.com/deltix.docker/anvil/deltix-ember:1.14.149"