Tuning Ember for Market Maker - Part 2
February 2024
Overview
This technical article takes a step beyond the basic steps described in part 1. While the previous article focused on optimizing market data latency, this time we dive into further steps to improve internal market data latency and achieve better tick-to-order latency. The key steps include:
- Switching to a tuned-up AMI. Pinning key components to isolated CPU cores and configuring busy-spin idle strategies.
- Using TimeBase Topics for market data distribution to MarketMaker algorithm.
- Configuring latency monitoring (high precision clocks, timestamp formats, latency dashboards).
Disclaimers
- These instructions assume your system has sufficient CPU capacity. For example, you need to assign dedicated physical CPU core for each tradeable exchange.
- You must be running on relatively recent versions of Deltix software to follow these instructions:
- TimeBase version 5.6.66+
- TimeBase Administrator 1.2.62+
- Ember 1.14.90+
- The configuration parameters discussed in this article are experimental and may change.
- We recommend discussing the applicability of these steps to your specific environment with the Deltix team.
Clocks and Timestamp Precision
Ember operates on a scale of low microseconds, where clocks from various sources (e.g., exchange clocks and local server clocks) are inherently out of sync. It's important to be aware of the timestamp's relation to its clock source.
Internally, Ember's timing relies on the Linux POSIX clock_gettime(REALTIME) API, which, at the time of writing, offers a resolution of 31 nanoseconds. Accessing the real-time clock comes with a cost—each query takes about 25 nanoseconds, but this cost can increase due to contention when multiple threads access the clock simultaneously.
In contrast, by default TimeBase operates with a clock that has a 1-millisecond resolution. TimeBase's approach to timekeeping is highly efficient (querying the current time is as cost-effective as an INT64 volatile read), enabling it to process millions of messages per second. However, MarketMaker works with significantly lower market data rates (up to 10K messages per second). In this article, we'll guide you through reconfiguring TimeBase (and the Aggregator) to utilize a higher resolution real-time clock source. Given the time-series nature of TimeBase, it's imperative that message timestamps increase monotonically (within the context of a single stream). This requirement for monotonicity introduces an additional CAS operation overhead when TimeBase or the Aggregator accesses the POSIX real-time clock.
To sum up, this article recommends transitioning TimeBase and the Aggregator to utilize clocks of higher precision, despite the potential reduction in throughput. This is considered an acceptable trade-off for the typical deployment of a Market Maker system.
Furthermore, we advise changing the timestamps in market data messages to nanosecond encoding, moving away from the default millisecond format.
CPU isolation, Disabled C-States, and tickless kernel
The easiest method to adopt optimized OS settings on AWS is by using a custom Amazon Machine Image (AMI) that incorporates the required adjustments. Deltix offers a GitHub project featuring an Ansible playbook for implementing the needed tuning on a basic AWS instance. Additionally, you can request that we share an AMI, produced by this script, with your AWS account. For details on what the AMI includes, you can refer to the OS tuning guide.
The rest of this document is based on the assumption that we're operating on a c6id.8xlarge instance type (as example), utilizing isolated vCPU cores 10-15 (along with their hyper-threading counterparts 26-31). You may have to isolate more CPU cores if you run larger number of trading connectors or use FIX gateways.
CPU Pinning
The configuration snippet below assigns Ember key components to these isolated cores, while positioning non-mission critical Ember threads on other CPUs.
affinity {
  # aeron media driver container:
  aeron-driver-shared       = [10]

  # ember critical path:
  algorithm-MM              = [11]
  journal-swapper           = [12] // debatable
  trade-engine              = [13]
  connector-BITMEX          = [14]
  connector-BINANCE         = [15]


  # non-critical:
  timebase-client                      = [6,7,8,9, 22,23,24,25]
  aeron-client-conductor               = [6,7,8,9, 22,23,24,25]
  message-bus-input-dispatcher         = [6,7,8,9, 22,23,24,25]
  logger                               = [6,7,8,9, 22,23,24,25]
  instrument-updater                   = [6,7,8,9, 22,23,24,25]
  CentralSMD                           = [6,7,8,9, 22,23,24,25]
  LocalSMStorage Flusher Thread 1      = [6,7,8,9, 22,23,24,25]
  network-healthcheck                  = [6,7,8,9, 22,23,24,25]
  "algorithm-FAKEFEED*"                = [6,7,8,9, 22,23,24,25]
  "connector-SIM"                      = [6,7,8,9, 22,23,24,25]
  default                              = [6,7,8,9, 22,23,24,25]
}
Take note that we've pinned the MarketMaker algorithm, OMS (identified by the thread name "trade-engine"), and trade connectors to isolated cores. These components are crucial in the tick-to-order event processing chain. We haven't isolated CPU cores for elements such as the Ember message bus or the FIX Order Entry gateway, as the MarketMaker does not utilize them in our basic scenario.
Also, note that the Aeron Media Driver thread (Aeron is operating in shared mode) is pinned to CPU core 10 with this configuration. Aeron plays a crucial role for the TimeBase topics that we will be utilizing in the subsequent steps.
CPU spinning
After pinning the MM algorithm to an isolated CPU core, we advise changing the market maker algorithm to a busy spin work cycle. This recommendation also extends to other key components involved in the tick-to-order signal transmission:
aeron.driver.sharedIdleStrategy= ${template.idleStrategy.noop}
algorithms.MM.idleStrategy = ${template.idleStrategy.noop}
messageBus.idleStrategy = ${template.idleStrategy.noop}
engineIdleStrategy = ${template.idleStrategy.noop}
swapperIdleStrategy = ${template.idleStrategy.noop}
connectors.BINANCE.idleStrategy = ${template.idleStrategy.noop}
connectors.BITMEX.idleStrategy = ${template.idleStrategy.noop}
Switch market data to TimeBase Topics
We'll utilize TimeBase topics for faster transmission of market data within our system. This messaging mechanism is powered by the Aeron library. In this section, we'll outline the settings for the Aeron Media driver container. Important aspects to focus on include:
- Mapping Aeron home directory to shared memory.
- Ensuring sufficient memory allocation for involved containers. The Aeron media driver process itself (JVM only) requires only 200Mb. However, the Aeron container must have ample RAM (off-heap memory accessible to the JVM) to accommodate data exchange within each topic. With default settings, the approximate additional memory requirement can be calculated as:
(50 * number-of-topics) Mb, wherenumber-of-topicscorresponds to the number of market data connectors you plan to convert to TimeBase Topics. For example, to accommodate 20 topics we would need an additional 1000 megabytes of container memory. More information about this formula can be found in TimeBase knowledge base.
All containers that produce and consume market data into topics would need this additional memory added reserved memory limit in docker-compose.yml. In MarketMaker case this extends to four containers: Aron, Aggregator, TimeBase, and Ember. However, since this additional memory is going to be shared memory, all this container will receive the same area of host RAM. In other words, additional 1000Mb mentioned in example above will not be multiplied by four.
Example Aeron service definition in docker-compose.yml:
  aeron:
    image: "registry.deltixhub.com/deltix.docker/market-maker/market-maker-pack:${MMEMBER_PACK_VERSION}"
    restart: unless-stopped
    environment:
      - AERON_DRIVER_OPTS=
        -Xms256m
        -Xmx256m
        -XX:+AlwaysPreTouch
        -Daeron.dir=/aeron-home/aeron
        -Daeron.mtu.length=16k
        -Daeron.socket.so_sndbuf=2m
        -Daeron.socket.so_rcvbuf=2m
        -Daeron.rcv.initial.window.length=2m
        -Dagrona.disable.bounds.checks=true
        -Daeron.term.buffer.sparse.file=false
        -Daeron.driver.timeout=60000
        -Daeron.client.liveness.timeout=60000000000
        -Daeron.publication.unblock.timeout=65000000000
    entrypoint: [ "/opt/deltix/ember/bin/aeron-driver" ]
    volumes:
      - "./ember-home:/var/lib/emberhome:ro"
      - "/dev/shm:/aeron-home"
    network_mode: "host"
    ipc: shareable
    deploy:
      resources:
        limits:
          memory: 1256M
Notice ipc, network_mode, memory limit, and JVM memory settings; as well as mapping of Aeron home directory to /dev/shm.
TimeBase
- Make sure TimeBase can see Aeron home directory using volume mounts.
- Switch TimeBase clock to high-resolution monotonic real time clock using
TimeBase.timeSourceName=MonotonicRealTimeSourcesetting incommon/timebase-admin.properties. - Set
TimeBase.topics.totalTermMemoryLimit=<LIMIT>MBparameter to the amount memory reserved for Aeron off-heap buffers. See Aeron memory allocation formula above. This setting ensures that TimeBase will not create more topics than Aeron memory capacity would allow.
Example config (showing settings of interest):
  timebase:
    image: "registry.deltixhub.com/quantserver.docker/timebase/server:${TIMEBASE_VERSION}"
    ...
    depends_on:
      aeron:
        condition: service_started
    environment:
      - JAVA_OPTS=
        -DTimeBase.transport.aeron.external.driver.dir=/aeron-home/aeron
        -DTimeBase.transport.aeron.id.range=100:1000000000
        -DTimeBase.transport.aeron.topic.ipc.term.buffer.length=16777216
        -Xms8G
        -Xmx8G
        -XX:+UseZGC
        -XX:-ZUncommit
        -XX:+AlwaysPreTouch
        ...
    volumes:
      - "/dev/shm:/aeron-home"
      ...
    ipc: "service:aeron"
    deploy:
      resources:
        limits:
          memory: 9000M
    network_mode: "host"
Aggregator
- Make sure Aggregator see Aeron home directory.
- Enable auto-creation of TimeBase topics using
-Ddeltix.qsrv.hf.agg.enable.topic.auto.creation=truesystem setting. - Make sure to switch Aggregator clock to high-resolution monotonic real time clock using
Aggregator.timeSourceName=MonotonicRealTimeSourcesetting incommon/aggregator-admin.properties.
Example config (showing settings of interest):
  aggregator:
    depends_on:
      timebase:
        condition: service_healthy
      aeron:
        condition: service_started
    environment:
      - JAVA_OPTS=
        -Ddeltix.qsrv.hf.agg.enable.topic.auto.creation=true
        -Xms4g
        -Xmx4g
        -XX:+UseZGC
        -XX:-ZUncommit
        -XX:+AlwaysPreTouch
        -DTimeBase.transport.aeron.directory=/aeron-home/aeron
    volumes:
      - "/dev/shm:/aeron-home"
    network_mode: "host"
    ipc: "service:aeron"
Ember
In addition to CPU pinning and idle strategies configuration we mentioned above, lets focus on:
- Making sure Ember can see Aeron home directory.
- Making sure Ember container has enough off-heap memory left by Java process to map topic buffers
- Enabling latency monitoring in trading connectors, MarketMaker algorithm, and OMS:
algorithms.MM.latencyTracer.statInterval = 15s
engine.latencyTracer.statInterval = 15s
connectors.KRAKENFUT.latencyTracer.statInterval = 15s
For algorithm developers
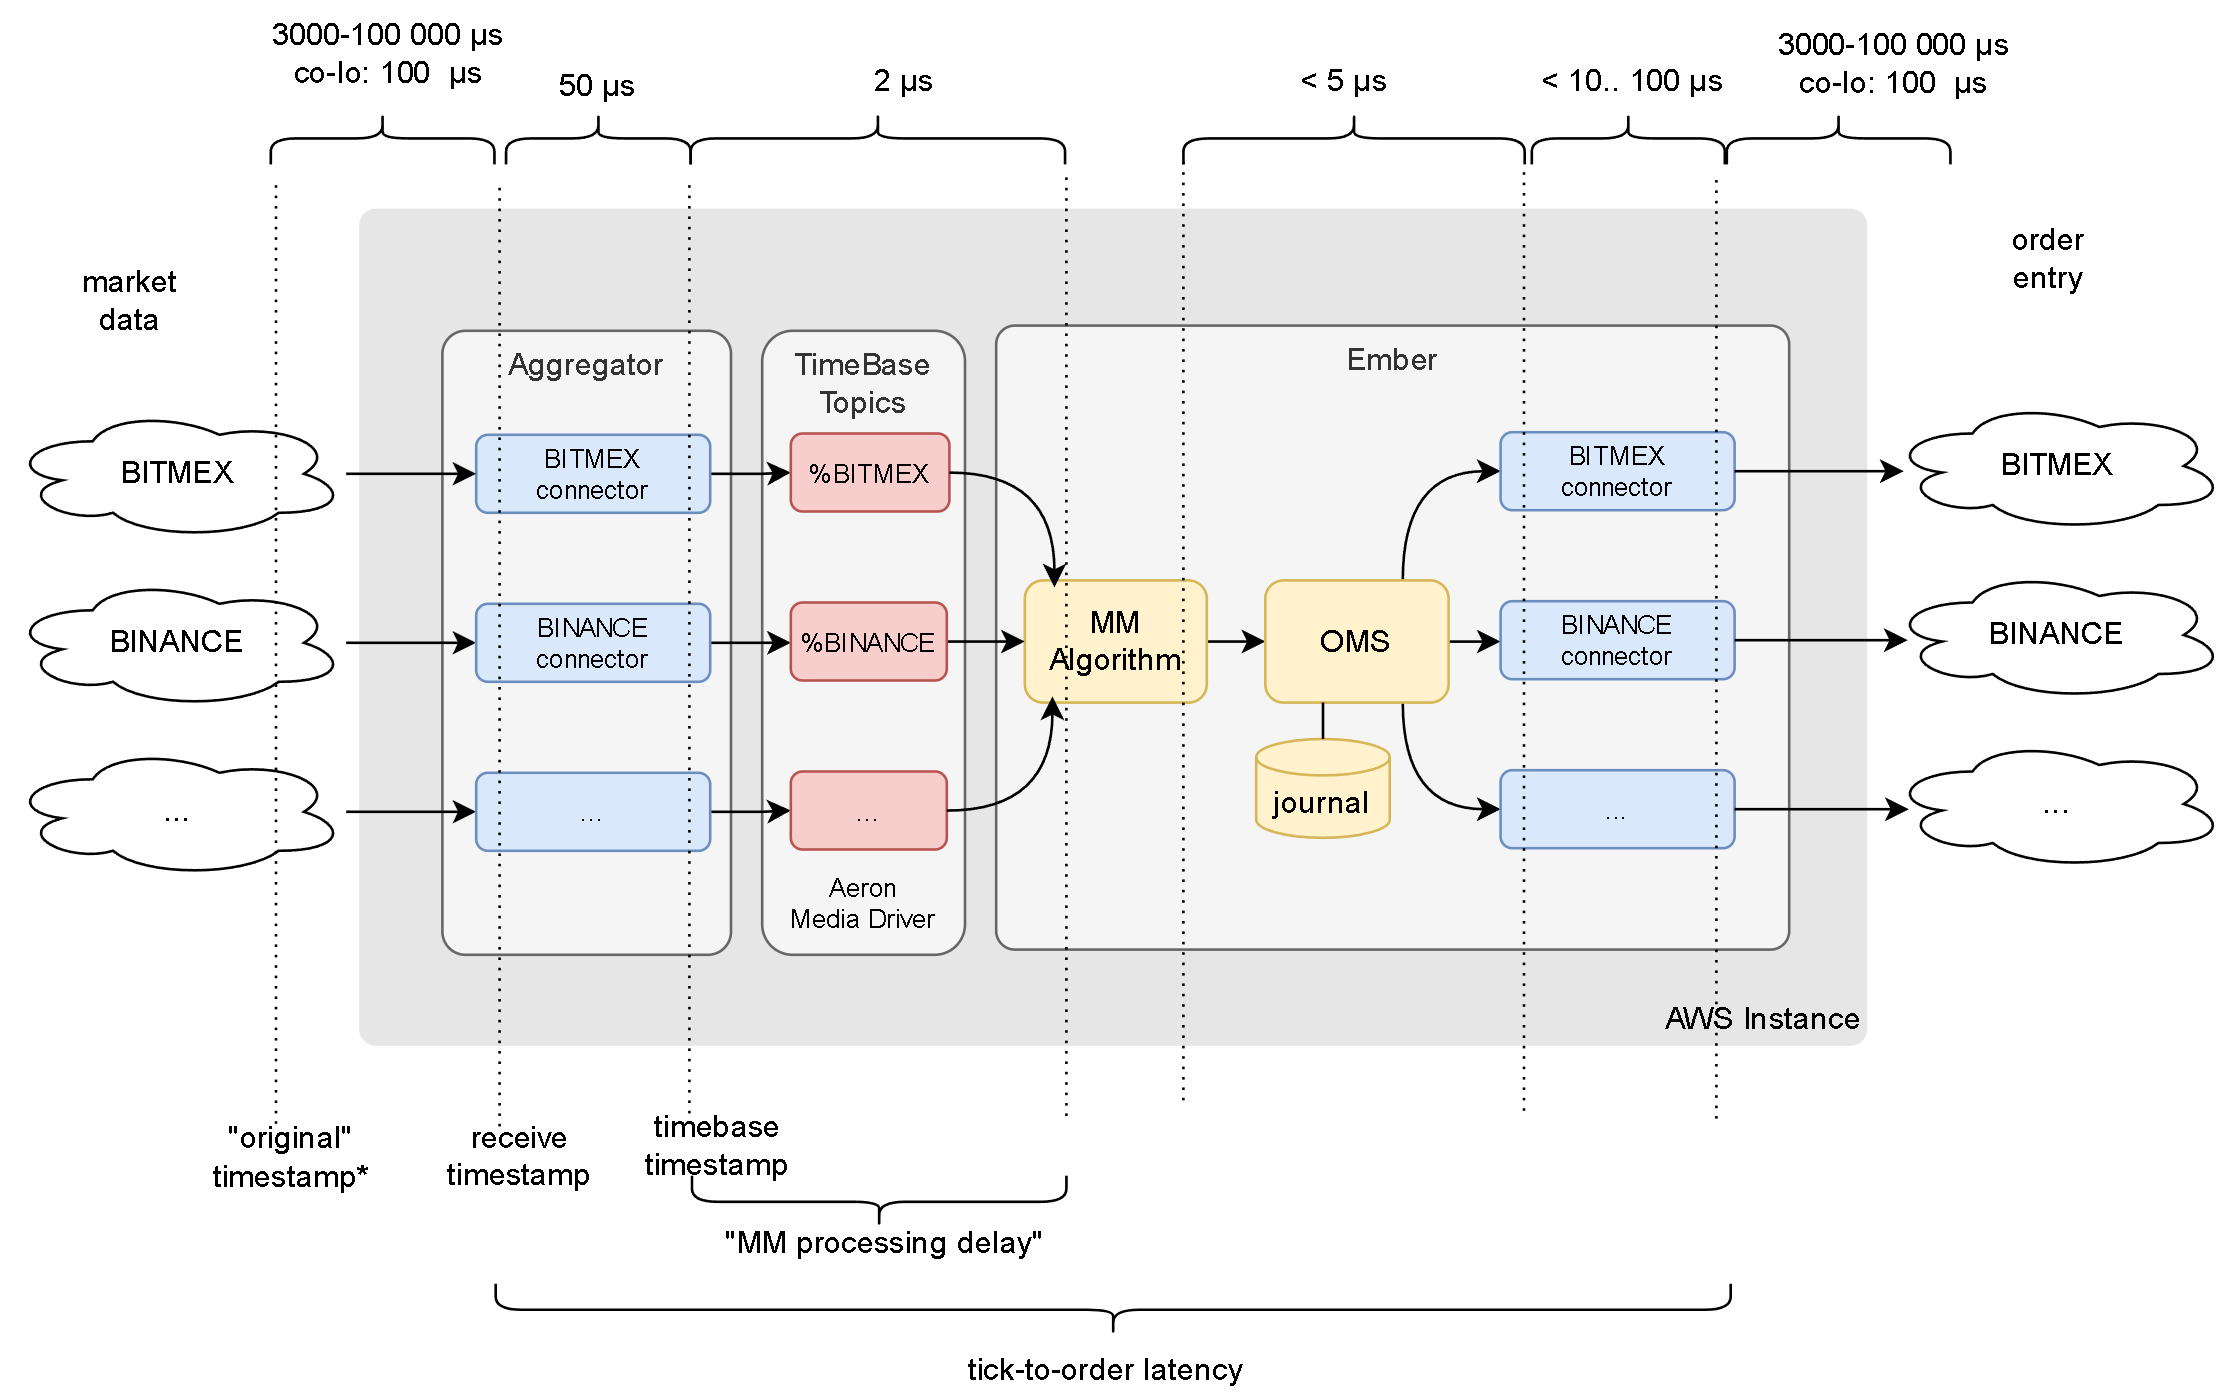
The measurement of tick-to-order latency depends on the capability to associate an order with the tick (market data update) that triggered it. For internal latency tracking, we request algorithm developers to replicate the market data receive time (or TimeBase timestamp) as the order's original timestamp. The example below provides a straightforward illustration of how to accomplish this: :::
private void onMarketMessage (MarketMessage message) {
    if (goLong(message)) {
        MutableOrderNewRequest result = orderProcessor.makeSubmitRequest();         result.setSide(Side.BUY);
        result.setSymbol(message.getSymbol());
        // initialize other order attributes
        ...

        result.setOriginalTimestampNs(
	        message.hasReceiveTimestamp() ?
		        message.getReceiveTimestampNs() :
		        message.getTimeStampNs());
        submit(result);
    }
}
- You do not need to do it for orders that are not in direct response to changing market conditions.
- You can also do this for order replacement and cancellation requests.
Universe Configurator
- Reconfigure key market data connectors to write data into topics instead of streams.
To convert a specific market data connector to utilize a TimeBase topic, prefix the target stream name with a %. For instance, entering "%KRAKEN" will automatically create the "%KRAKEN" topic as well as a corresponding "normal" carbon copy stream named "KRAKEN".
For enhanced system stability, only the MM algorithm itself should read data from the topic. The remainder of the system should access data through the associated carbon copy stream.
Enable nanosecond precision in TimeBase TIMESTAMP fields
As of February 2024, TimeBase uses millisecond time precision for TIMESTAMP fields by default. Since our system will be demonstrating sub-millisecond latencies we need to Enable sub-millisecond precision for market data timestamps. Follow these steps:
- Stop Aggregator and Ember.
- Go to TimeBase Administrator UI .
- Delete Topic (if any).
- Edit data schema of the associated carbon copy stream.
- Locate
receiveTimestampandoriginalTimestampfields and change field encoding to NANOSECOND.
- Restart Aggregator (this will recreate topic using carbon copy stream schema as template).
Starting from TimeBase version 5.6.67 you can modify stream schema using DDL:
ALTER STREAM binance
  ALTER CLASS "deltix.timebase.api.messages.MarketMessage" (
    ALTER FIELD "receiveTimestamp" SET ENCODING NANOSECOND;
    ALTER FIELD "originalTimestamp" SET ENCODING NANOSECOND
  )
CONFIRM CONVERT_DATA
Market Maker
Please configure the following setting to enable tick-to-order latency metrics. This correlates market maker trading orders with market data events that trigger them.
algorithms.MM.settings.receiveTimeToOriginalTimeEnabled = true
Results
The following diagrams show internal latency metrics observed:
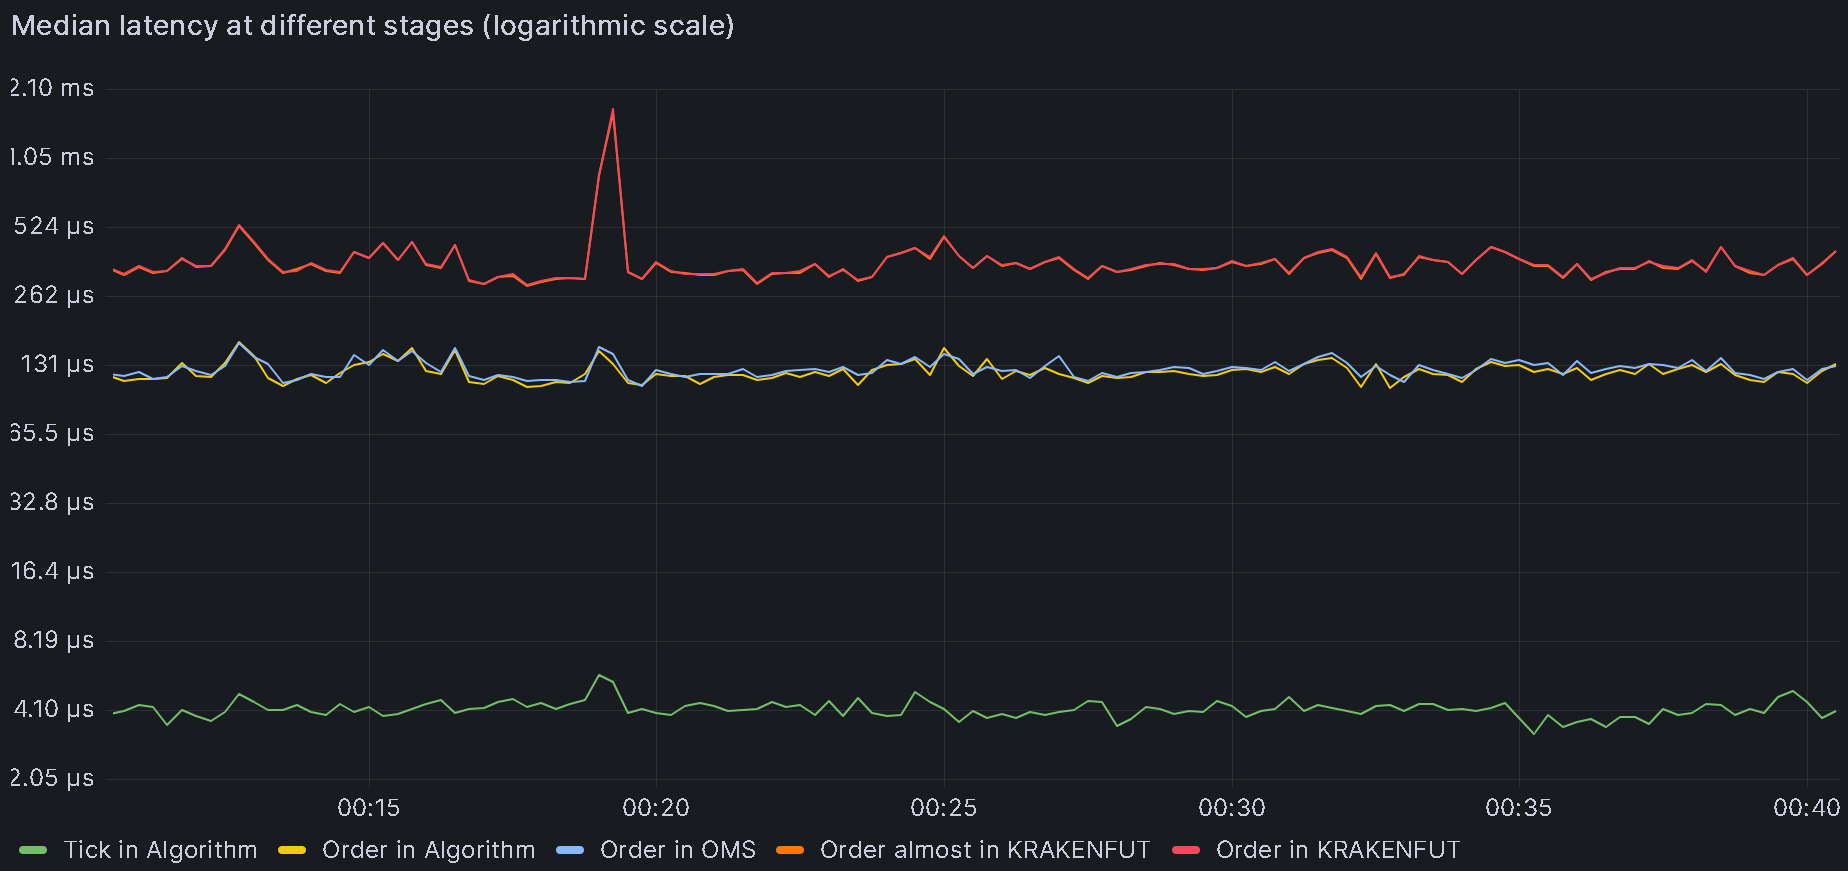
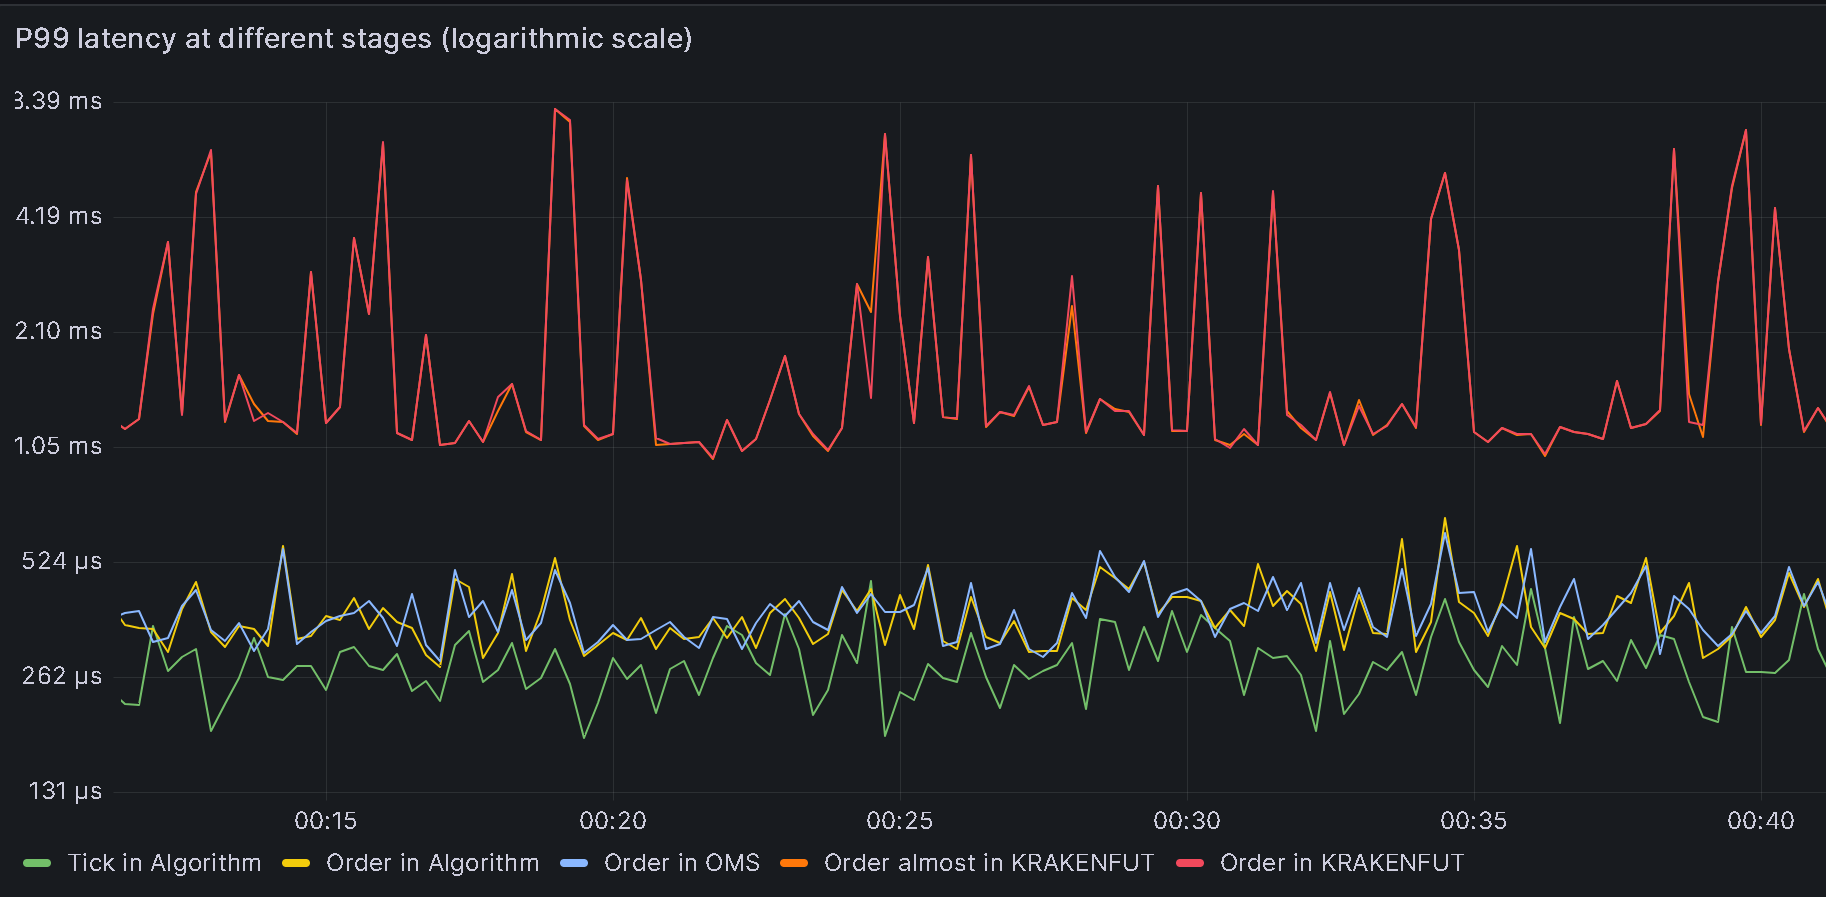
As of February 2024 described set of MarketMaker tune ups lead to median tick-to-order latency of 300-600 microseconds (depending on trading connector). Observed P99 was below 400-2000 microseconds (also depending on REST/WS trading connector).
Next steps: Bulk of processing time and jitter is caused by REST/WS crypto trading connectors. Connectors based on FIX protocol are significantly better in this aspect. Deltix plans to optimize REST/WS connectors during spring 2024 to improve these numbers.
Appendix A: Baseline latency
It could be beneficial to compare the MarketMaker's tick-to-order latency with the numbers obtained from executing a simple trading algorithm designed to place a limit order every N-th market tick. For this comparison, we will utilize the TickToOrderAlgorithm, which is included specifically for this purpose within the Ember distribution.
Example of ember configuration you can use:
algorithms {
  TICK2ORDER: ${template.algorithm.default} {
    factory = "deltix.ember.service.algorithm.samples.t2o.TickToOrderAlgorithmFactory"
    subscription {
      streams: [ "%KRAKENFUT"]
    }
    settings {
      inOutRatio: 25
      submissionDelay: 15s
      destinationConnector: "BINANCEFUT"
      destinationExchange: "BINANCE"
    }
    latencyTracer {
      statInterval = 15s
    }
    idleStrategy = ${template.idleStrategy.noop}
  }
}
affinity {
  algorithm-TICK2ORDER      = [14]
}
Where:
inOutRatiocontrols how often new orders are sent to destination connector. For example when this parameter set to 1000, then algorithm will output an order for every 1000 input market messages.submissionDelaycontrols startup delay before algorithm begins order submissions.
Grafana dashboard showing tick-to-order latency of baseline algorithm:
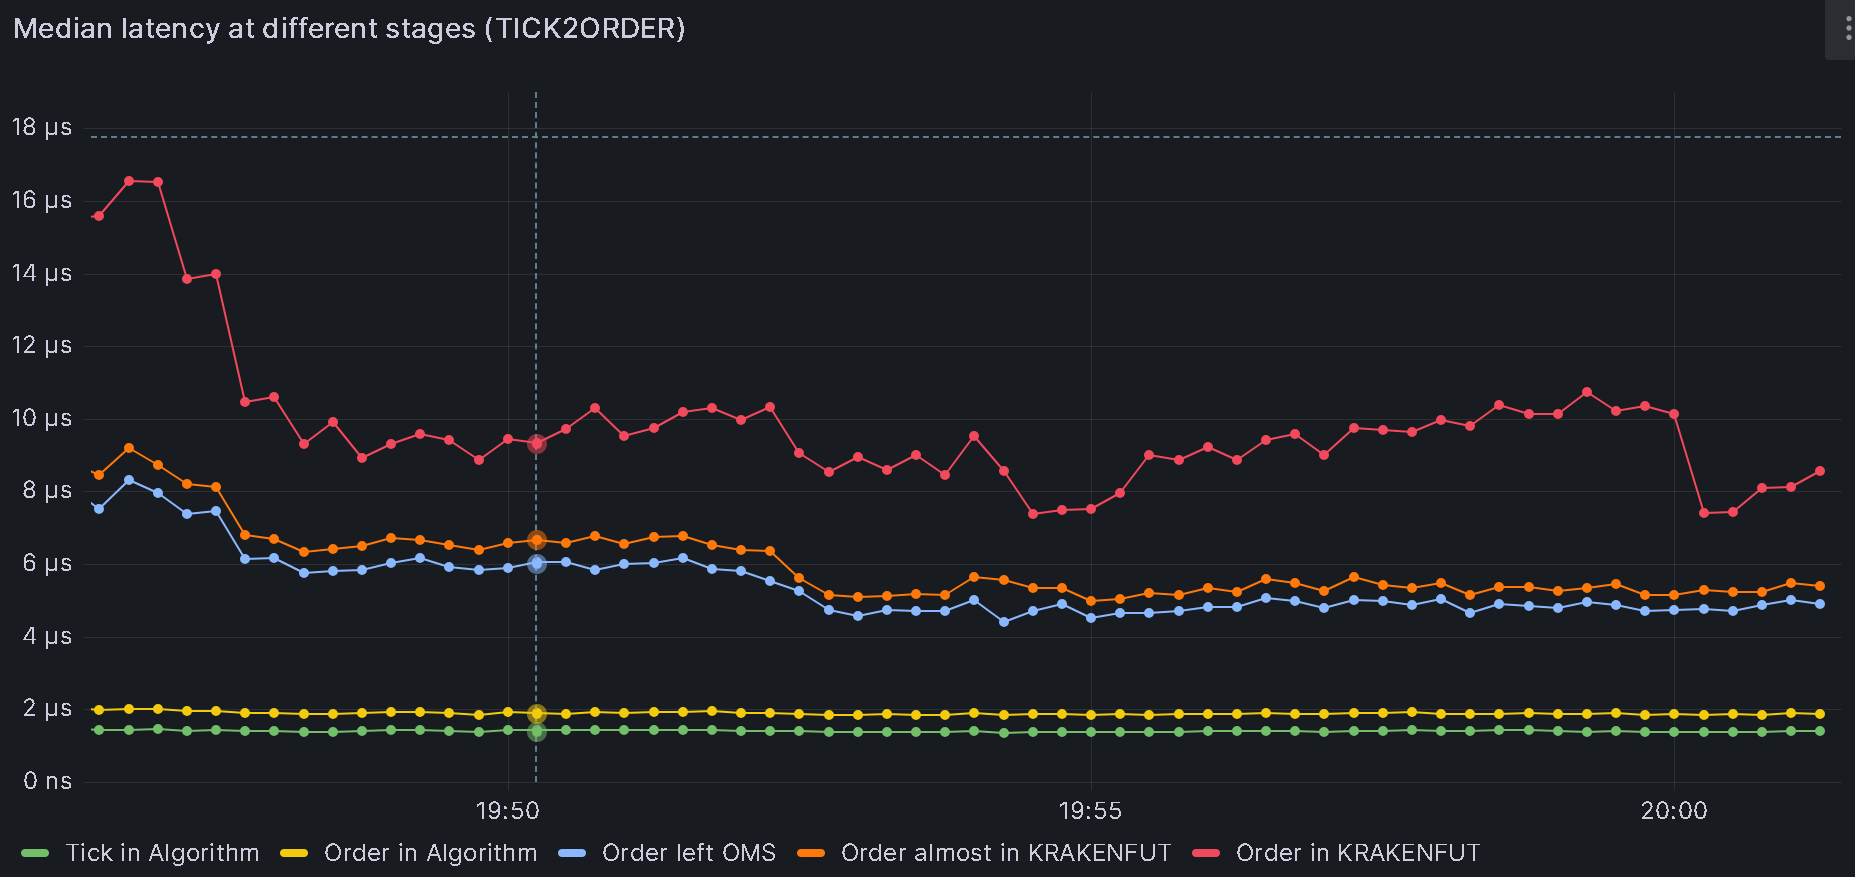
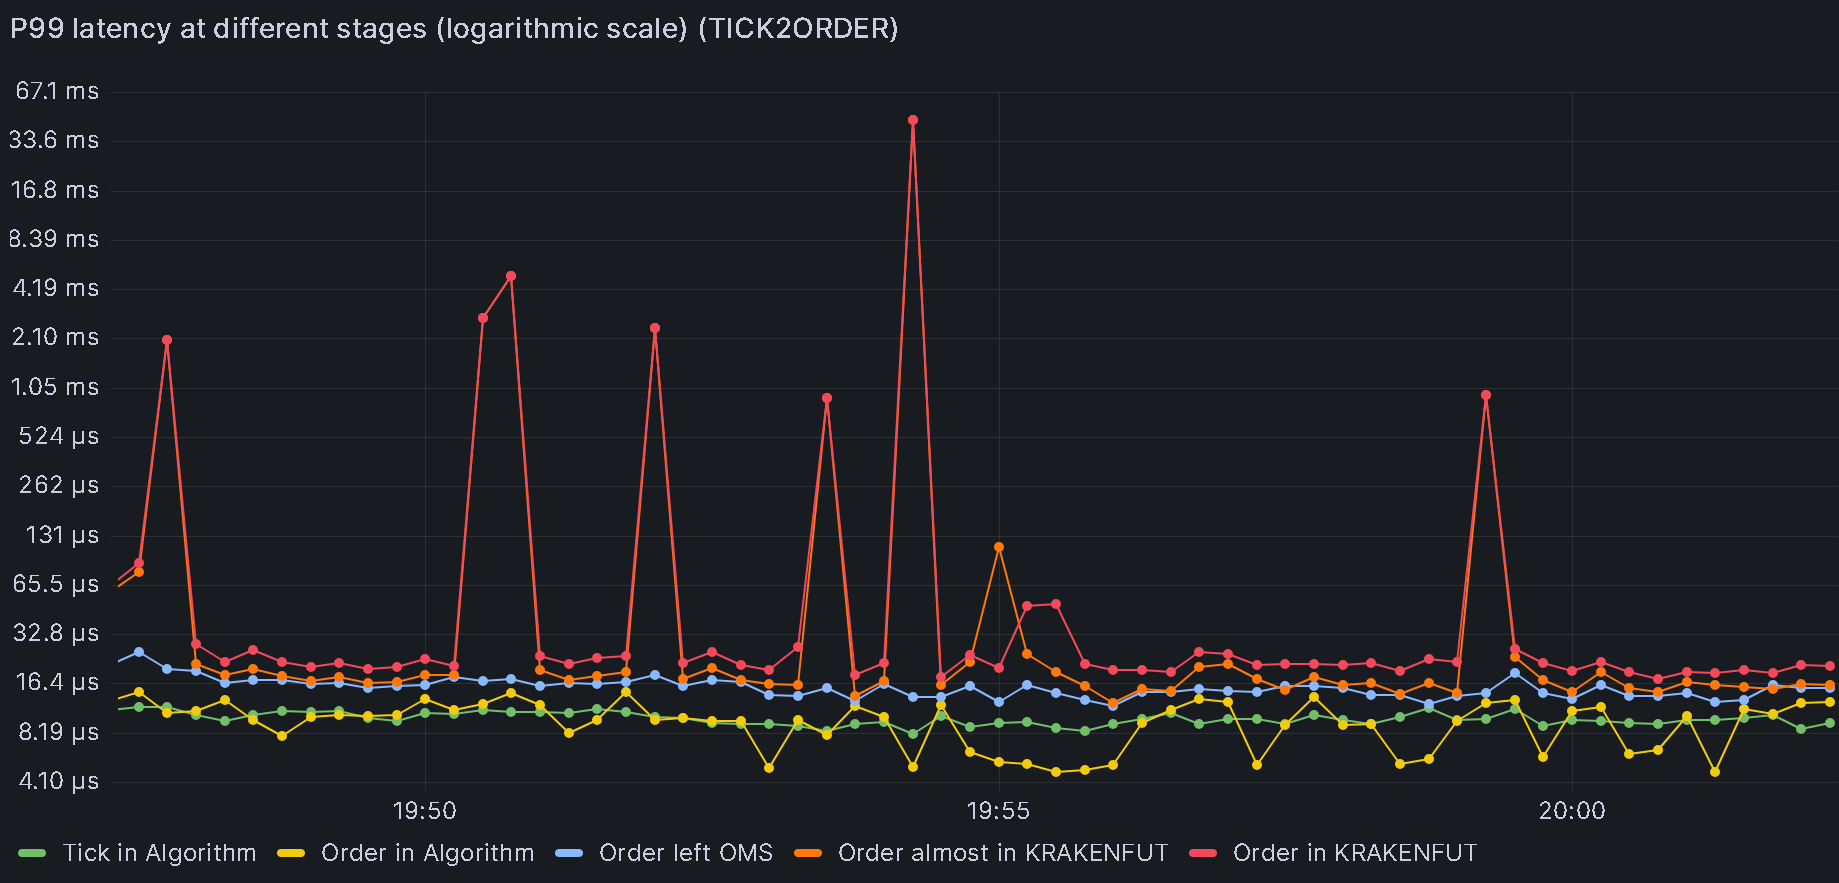 Bottom line: tick-to-order latency of baseline trading algorithm is
- Median < 15 microseconds
- P99 < 45000 microseconds (bad)
Appendix B - Latency Monitoring in Ember
There are three ways to analyze processing latencies in Ember:
- Built-in metrics
- Timestamps on recorded data
- Network Packet Capture
Method 1: Built-in latency metrics
Starting with Ember version 1.14.80, system has the capability to periodically report** tick-to-order** latency percentiles. The metrics that are made available include:
- PMIN (Minimum)
- P50 (Median)
- P99 (99%)
- P999 (99.9%)
- P9999 (99.99%)
- P99999 (99.999%)
- P100 (Maximum)
- Total (The total number of signals reflected in the current percentile figures)
- Timestamp (The timestamp at which the latest figures were reported)
- Error (The number of errors in latency measurements, which ideally should be 0)
All latency metrics report values in nanoseconds.
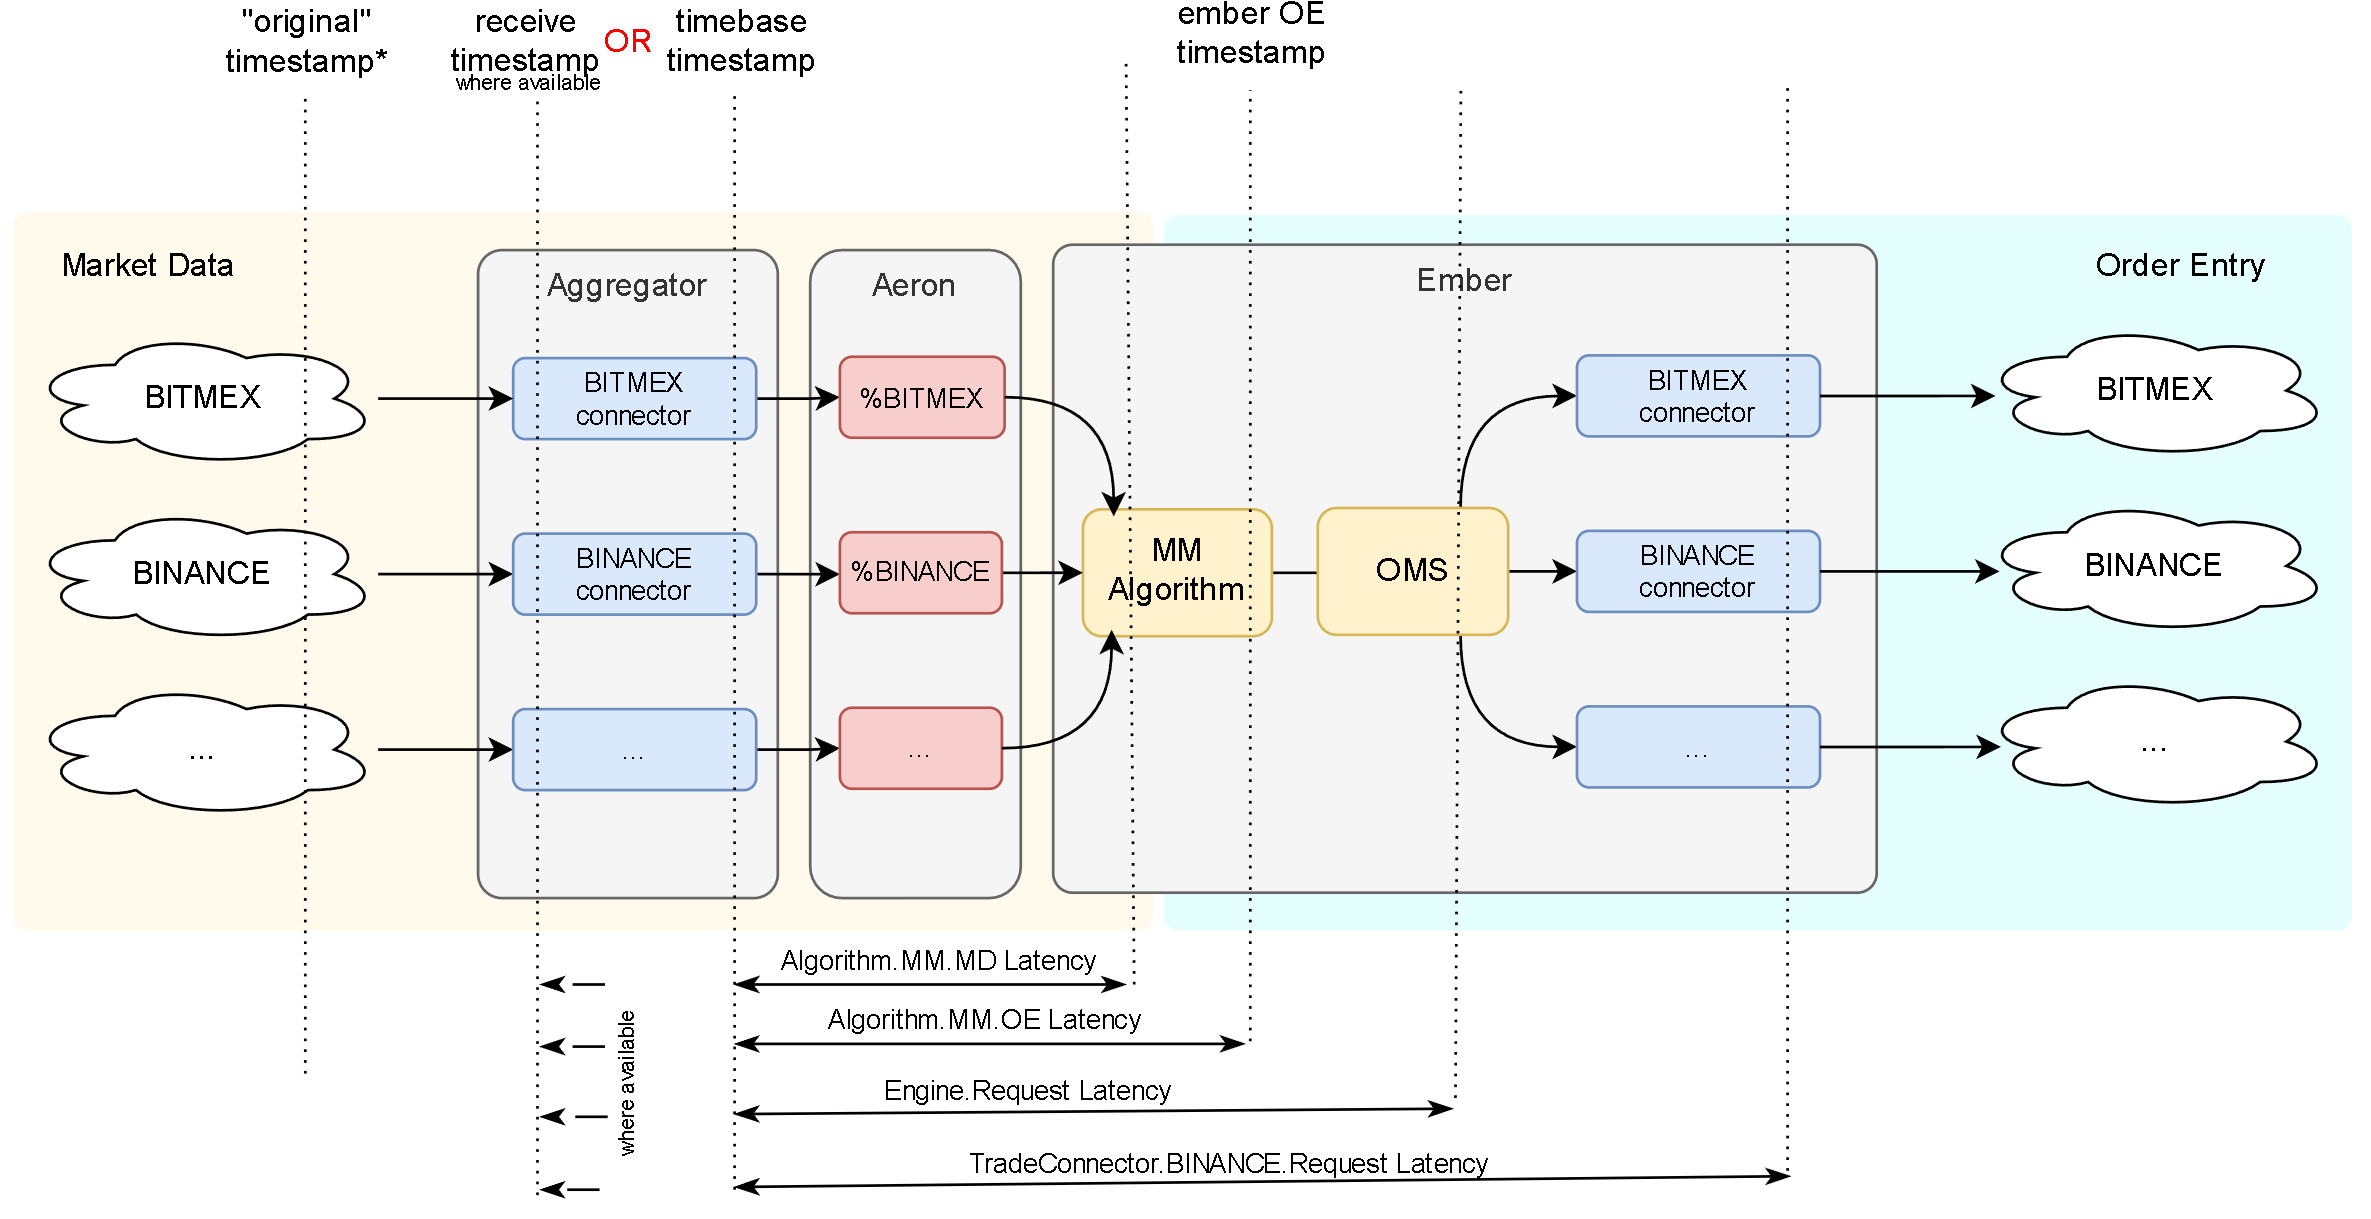
Few examples:
- Algorithm.MM.MDLat.P50 - Median (P50) Market Data (MD) Latency for algorithm MM in nanoseconds.
- TradeConnector.BINANCE.RequestLat.P99 - 99% percentile for request latency in BINANCE trading connector (in nanos).
It's important to note that the accuracy of the reported latency metrics is contingent upon whether the data connector includes a receiveTimestamp in the market data messages. As of February 2024, only a few data connectors supported this field. As a fallback internal latency uses main timestamp field that is initialized by TimeBase client before message is written into TimeBase topic.
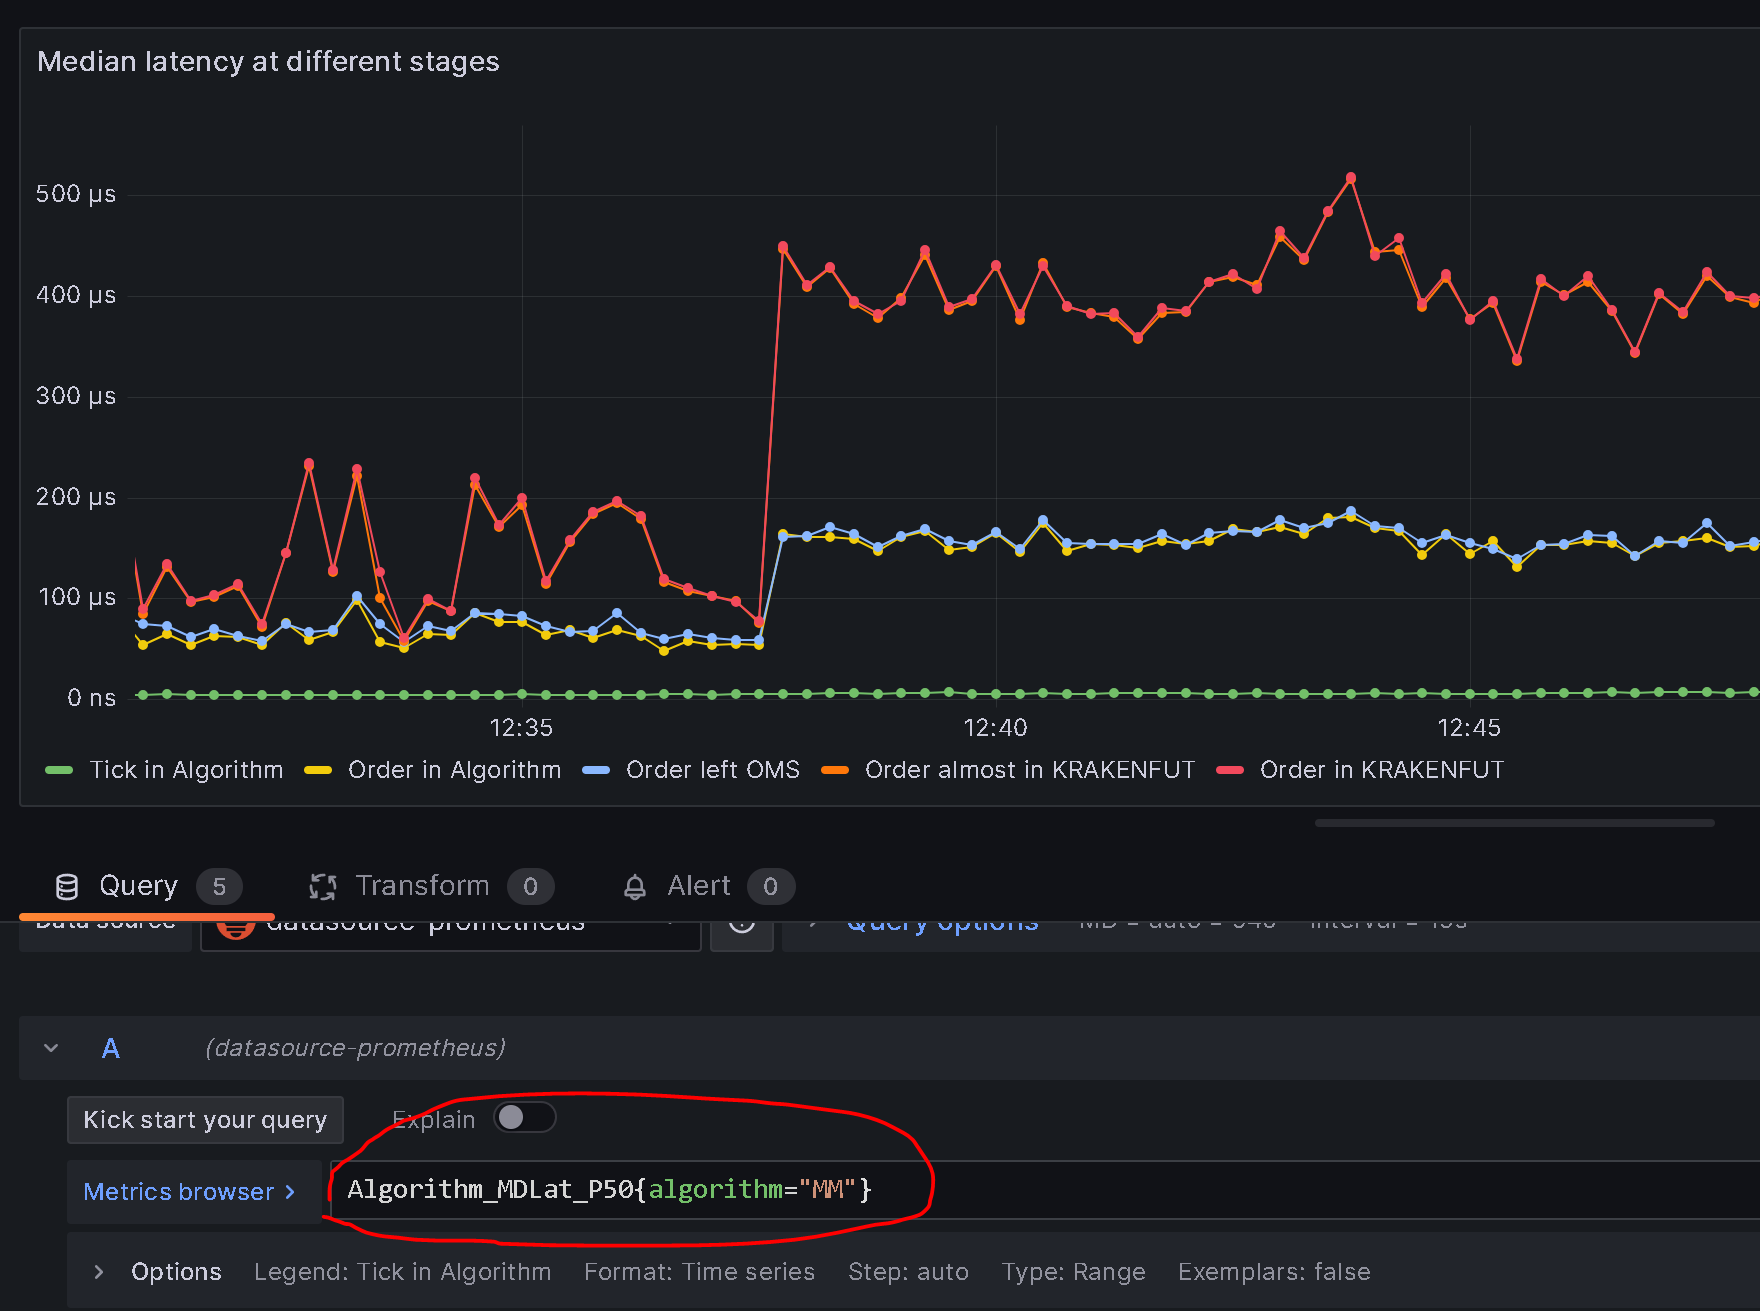
These latency metrics are available as "telemetry" counters in Ember Monitor, via CLI API, or in Prometheus/Grafana.
-
Algorithm.<ID>.MDLattracks interval from the moment when market message was received by Aggregator to the moment of time the message was read by the algorithm. For example,Algorithm.MM.MDLat.P50tracks median market data latency forMMalgorithm (standard identifier for MarketMaker algo). -
Algorithm.<ID>.OELattracks interval from the moment when market message was received by Aggregator to the moment of time the order request was created by the algorithm (OE stands for Order Entry). -
Engine.RequestLatinterval from the moment when market message was received by Aggregator to the moment of time the order request was completely processed by Ember OMS and dispatched into trading connector request queue. -
TradeConnector.ID.RequestLatinterval from the moment when market message was received by Aggregator to the moment of time the order request converted to native exchange API is about to leave trading connector. This is essentially Ember internal tick-to-order latency. For example,TradeConnector.BINANCE.Request.P99tracks 99% tick to order latency for BINANCE trade connector. -
TradeConnector.ID.PreLatinternal metric that captures latency up to the moment Ember's thread that hosts a trade connector is about to dispatch trading request to connector-specific code. By this time trading request has travelled from Ember OMS Engine into connector queue, has been deserialized from connector-specific queue and ready for trade connector processing (which typically covert trading request into exchange-specific API message and transmit it downstream socket). This internal metric is useful to compare withTradeConnector.ID.RequestLatif we want to detect if slow trading connector code is the cause of higher than expected latency. -
TradeConnector.ID.PostLatinternal metric that captures latency reading at the moment Ember's thread received control back from connector-specific code (after the later one finished handling each trading request). This internal metric is useful to diagnose latency problems in trading connector code.
The following screenshot shows process of adding latency metrics in Grafana:
Method 2: Recorded timestamps
Data messages passing through the Deltix system contain various fields that facilitate latency analysis. This information is captured in TimeBase, Ember Journal, and Ember Data Warehouses, enabling the examination of different latency metrics.
Market Data
- originalTimestamp - timestamp that comes from exchange (and it uses exchange clock).
- receiveTimestamp - when market data signal enters Deltix stack. For example, when data connector receives WebSocket payload from exchange price feed. This field was added in TimeBase 5.6 and gradually getting supported in more and more data connectors. This timestamp uses Deltix real-time monotonic clock.
- timestamp - when TimeBase messaging layer received market data message. For market data connectors that record data via TimeBase streams this timestamp is set by TimeBase server on message arrival. For connectors that record data into TimeBase topics this timestamp is set by TimeBase client code running in Aggregator (hosts data connectors). This timestamp uses Deltix real-time monotonic clock.
Order Entry - OrderRequests
- originalTimestamp
- for external orders (these usually come via FIX / REST API gateways) this timestamp is set by request originator - external client (and it uses client's clock).
- for internal orders (these come from Ember algorithms) emerging convention is to use market data timestamp, thus enabling tick-to-order latency measurements. In this case market data receiveTimestamp is used here (when available, otherwise ordinary market data message timestamp is used).
- timestamp
- for external orders this time is set by API gateway (and it uses system real-time clock)
- for internal orders this time is set by Ember algorithm framework.
Order Entry - OrderEvents
- originalTimestamp - comes from exchange or execution venue (or algorithm), where available.
- timestamp - this time is set by Ember connectors when they processed event. This timestamp uses system real-time clock.
Order Entry - FIX
Timestamp(60)- usually set from Order Request timestamp.SendingTime(52)- set by Deltix FIX engine, reflects moment of time after FIX message body is encoded and right before the engine does socket send.
Order Entry - REST
X-DELTIX-SIGNAL-ID- Field originalTimestamp from the Ember Order Request that triggered this REST order submission.
Method 3: Network packet capture
While the internal latency metrics described above are useful for monitoring trading latency in real time, it's always beneficial to verify the accuracy of these metrics. Capturing network packets received from the exchange (containing market data) and those sent back to the exchange (with trade orders), then comparing the kernel timestamps on these packets, allows us to measure the true system latency. Although this method is more complex, it yields more accurate results because it also accounts for the time spent in the OS's TCP layer and in the networking libraries used by the data and trading connectors.
For crypto exchanges, to inspect the contents of these packets, it's necessary to decrypt the TLS payload and decompress WebSocket messages. A detailed description of this process is available in this article.
The diagram below depicts a network packet capture, using the BINANCE exchange as an example. On the left, we present a sample of market data (an order book update), and on the right, we illustrate a sample BUY order (initiated via a REST API call). Inbound and outbound packets are correlated through timestamps.
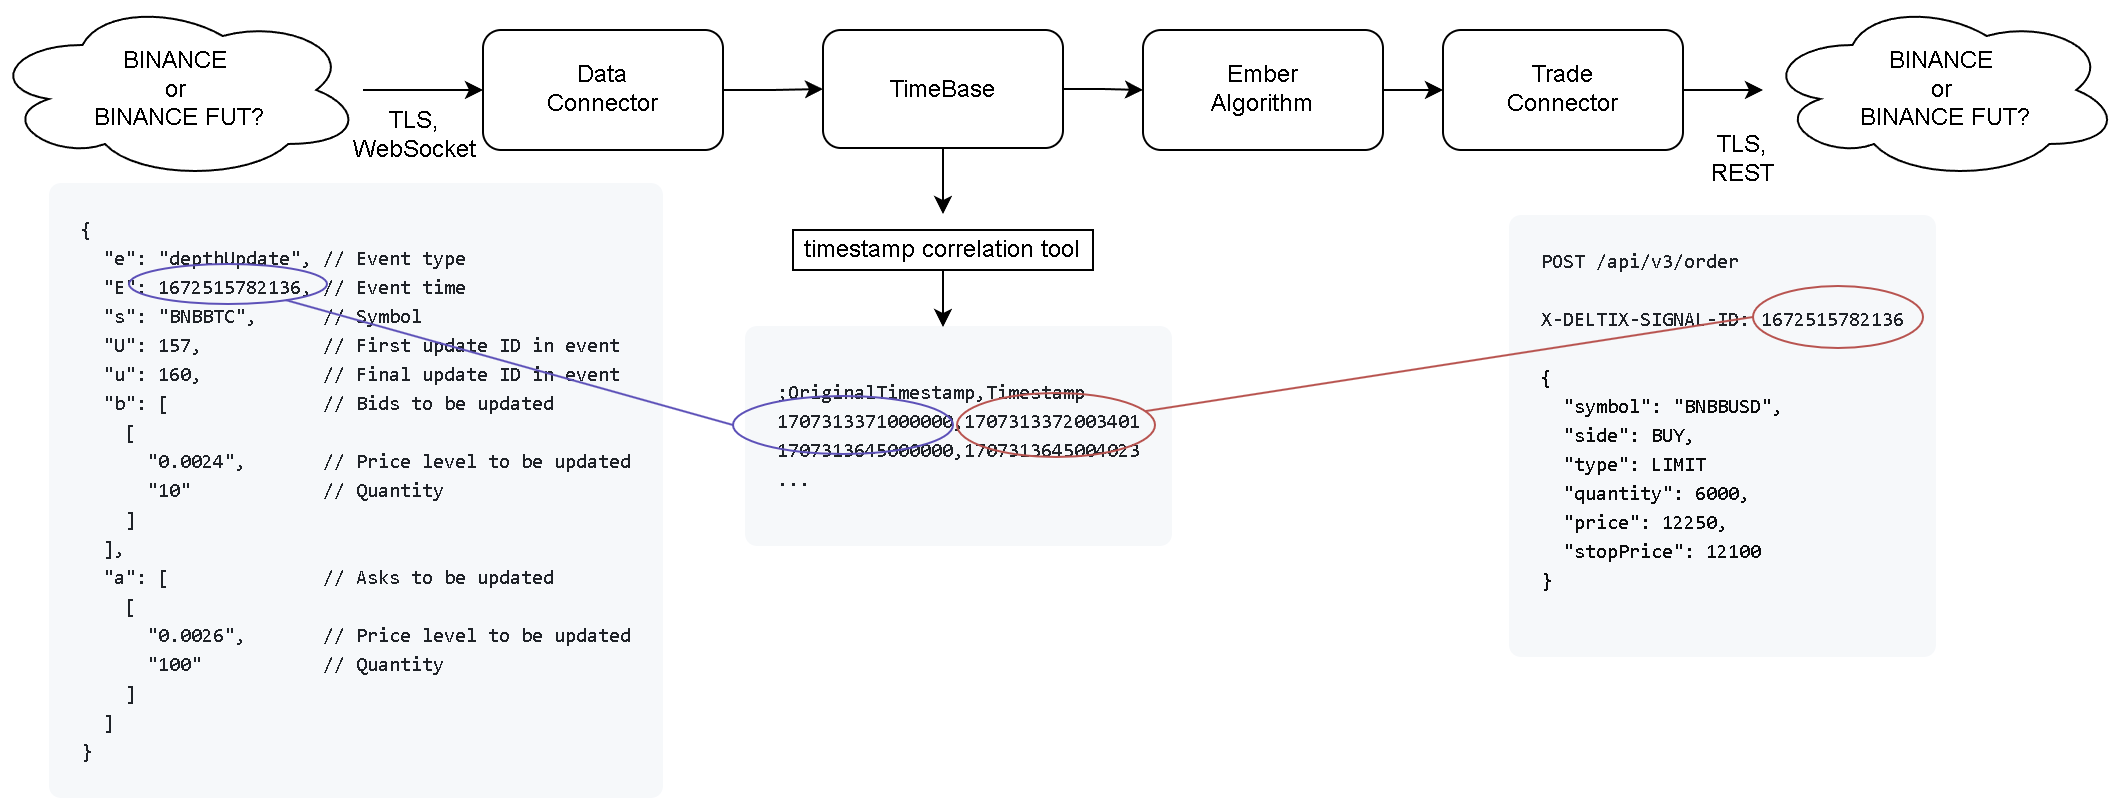
This approach is based on the premise that the original market data update timestamp, as provided by the exchange, is stored in TimeBase. We utilize the TimeBase message timestamp, which is recorded as the X-DELTIX-SIGNAL-ID custom HTTP header in the outbound packet.
One point to consider here is that there might be multiple inbound market messages bearing the same timestamp (since BINANCE uses epoch time in milliseconds). However, BINANCE typically throttles or conflates retail market data for each instrument.
It's also important to note for outbound requests that we need to handle not only POST but also PUT and DELETE verbs. Often, the MarketMaker might issue order modification or cancellation requests in response to changing market conditions.
Capture traffic
Detailed description of this step can be found here.
Before we begin capturing traffic we need to setup SSL keylogger so that we can decrypt it later. In the example below we show how to add SSL key logger to Aggregator container.
  aggregator:
    environment:
      - JAVA_OPTS=
        -javaagent:/sslkeylog/extract-tls-secrets-4.0.0.jar==/sslkeylog/sslkey.log
        ...
    volumes:
      - "./sslkeylog:/sslkeylog"
      - ...
Ember container should have similar adjustment to intercept TLS handshakes happening in trade connectors. Make sure both containers have file permissions to access SSLkeylog (sudo chown -R 1666:1666 ./sslkeylog).
Next, we use TCPDUMP to record packets (this example uses BINANCE market data and order entry gateways that we observed at the time):
sudo tcpdump -naX "(port 443 and (host 54.168.16.227 or host 52.68.120.192 or host 18.172.64.3 or host 18.172.64.34 or host 18.172.64.9 or host 18.172.64.105))" -w latency.pcap
Sample of captured packet in Wireshark:
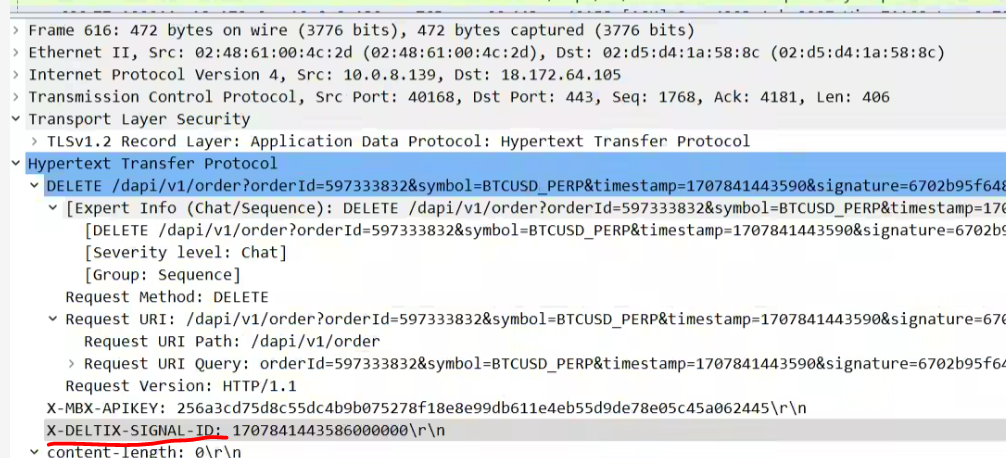
Use http.request and http contains "X-DELTIX-SIGNAL-ID:" filter to view order requests.
Timestamp correlation tool
Usage example:
java --add-opens=java.base/java.lang=ALL-UNNAMED \
-cp "/opt/deltix/ember/lib/*" \
deltix.ember.latency.TimestampCorrelationApp \
-stream BINANCE \
-start "2024-02-13T16:22:00Z" \
-end "2024-02-13T16:42:00Z" \
-o correlation-ids.csv