FIX Gateway Administrator Guide
Overview
Deltix FIX Gateway is part of the Deltix QuantServer solution for brokers, exchanges, and dark pools.
Deltix FIX Gateway can route orders and receive market data from the following points:
- Deltix Connectors to various execution venues. Deltix has experience connecting to more than a hundred brokers and exchanges, ranging from exchanges like CME and Eurex to brokers like Bloomberg and CTP.
- Deltix Execution Algorithms (SOR, TWAP, VWAP, ICEBERG, etc.).
- Deltix Matching Engines.
- Deltix Exchange Simulators.
FIX Order Flow can be subject to customizable pre-trade risk checks. The Deltix FIX Gateway component implements Order Entry and Market Data Gateways using FIX Protocol 4.4.
Design
This product can be deployed as a group of Order Entry and/or Market Data FIX gateways running on a single or multiple servers. Each gateway uses two CPU cores and handles a specific group of FIX client sessions (usually 100-1000).
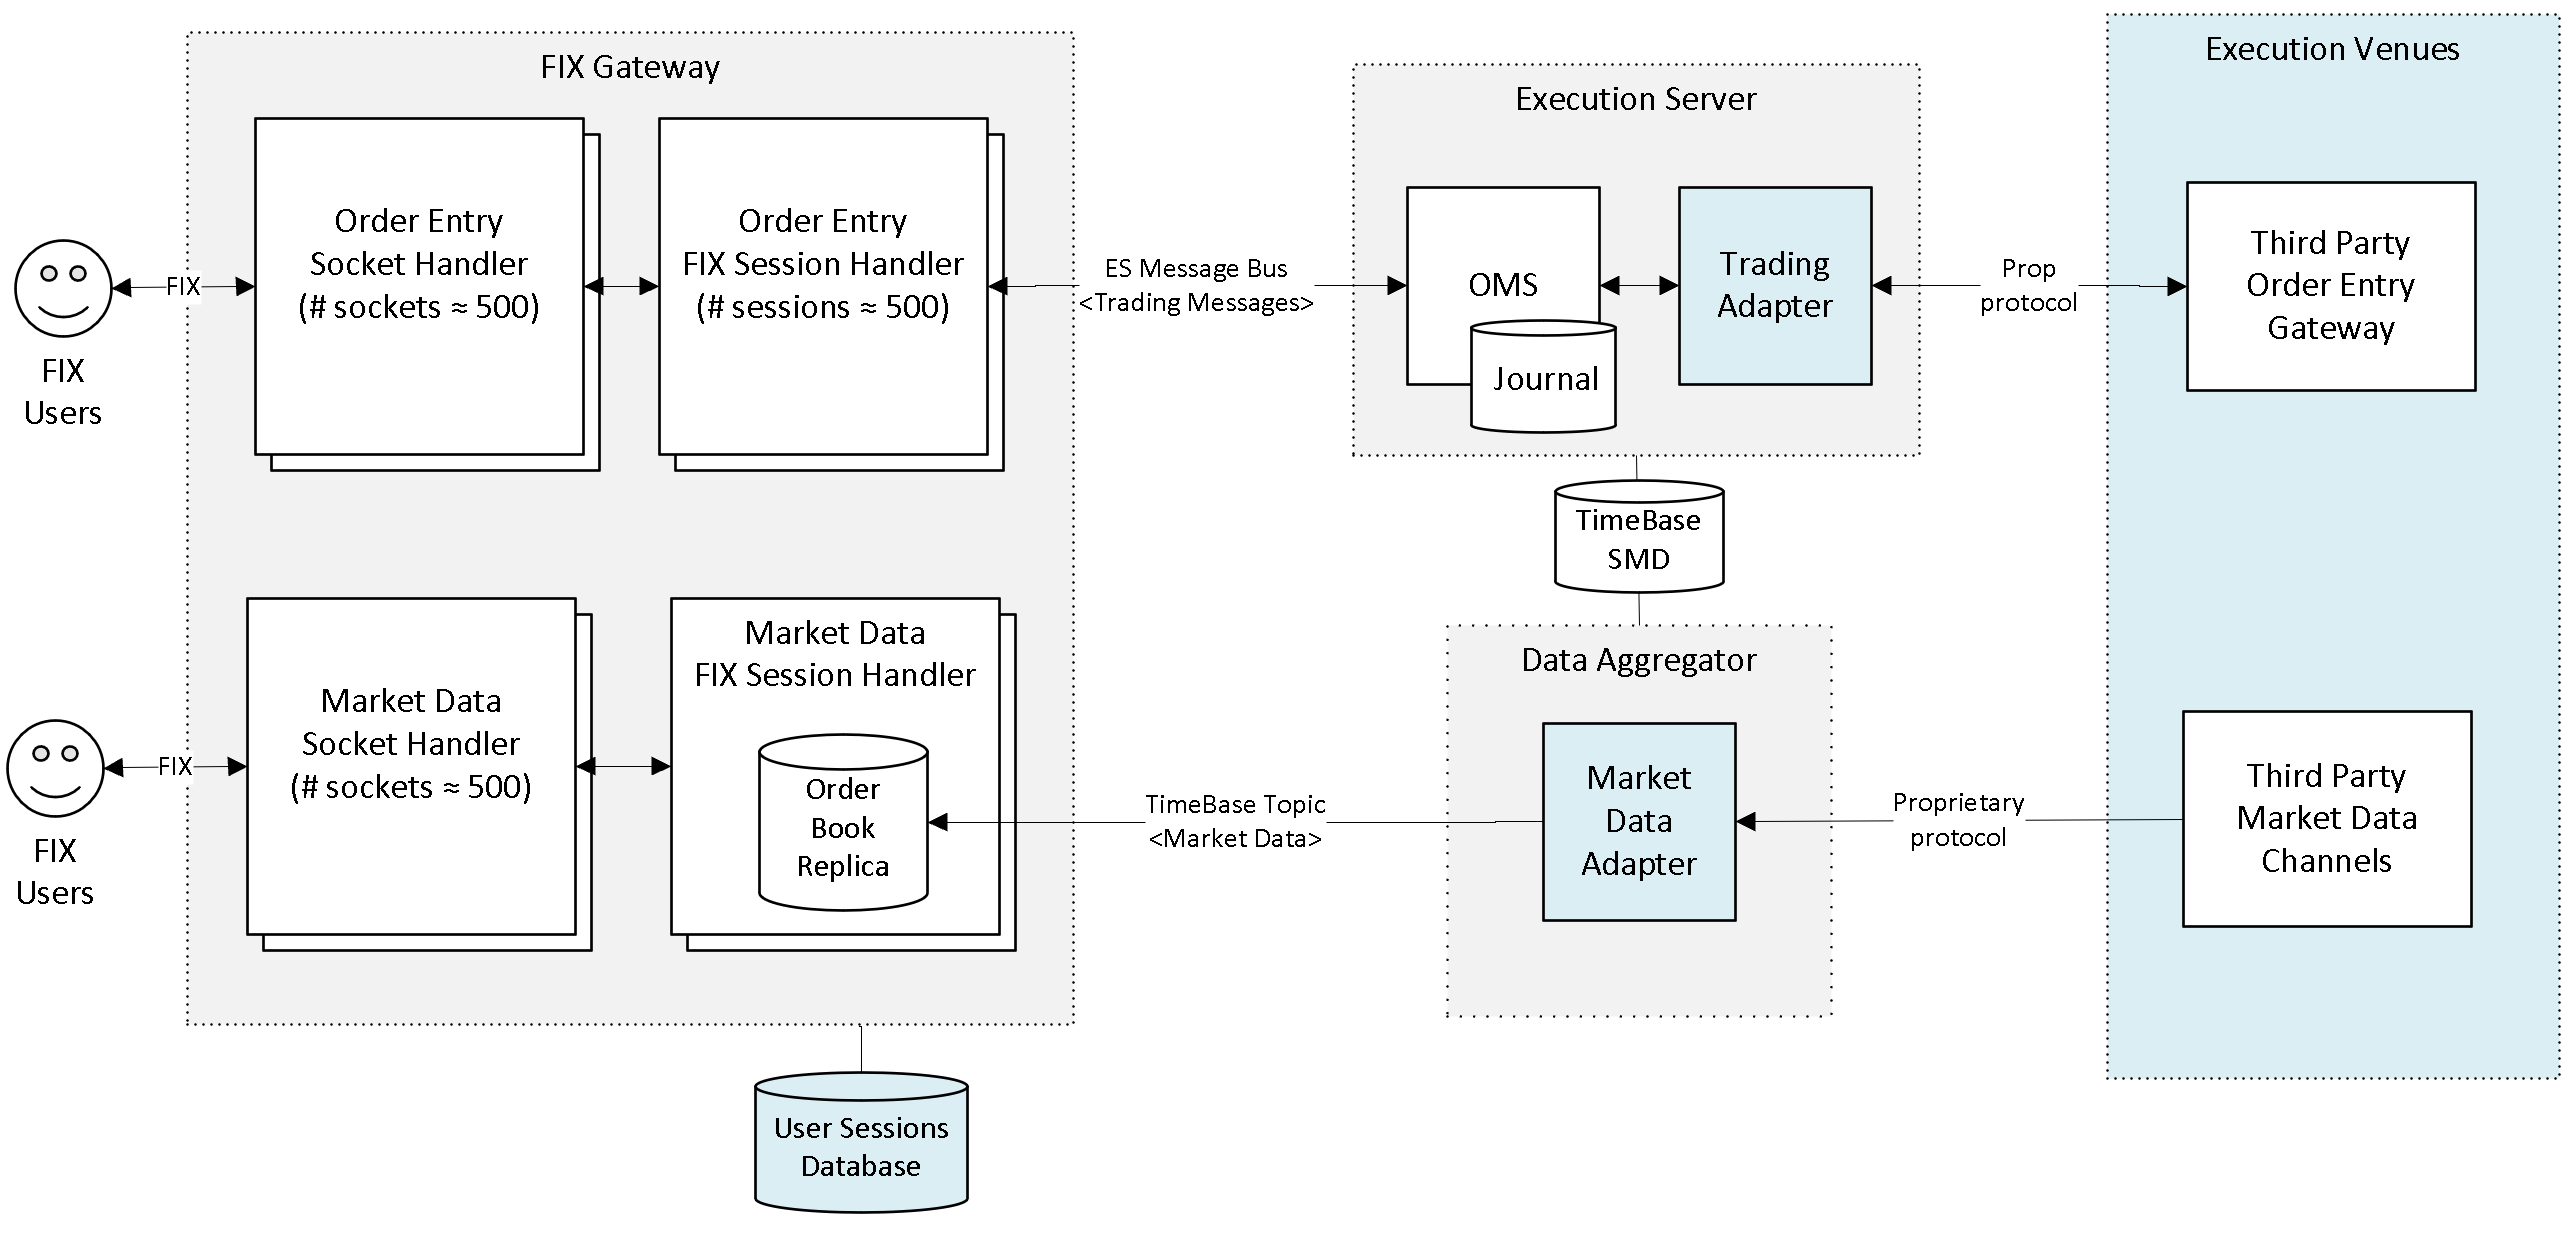
The Market Data Gateway works with the Deltix TimeBase and Aggregator products to distribute market data. The Order Entry Gateway works with the Ember and TimeBase to router orders and re-broadcast order events.
Market Data Gateway
Deltix FIX Gateway may run multiple instances of a Market Data Gateway (MDG). Each gateway re-broadcasts data from a pre-configured set of TimeBase streams (Deltix internal messaging middleware and time-series database).
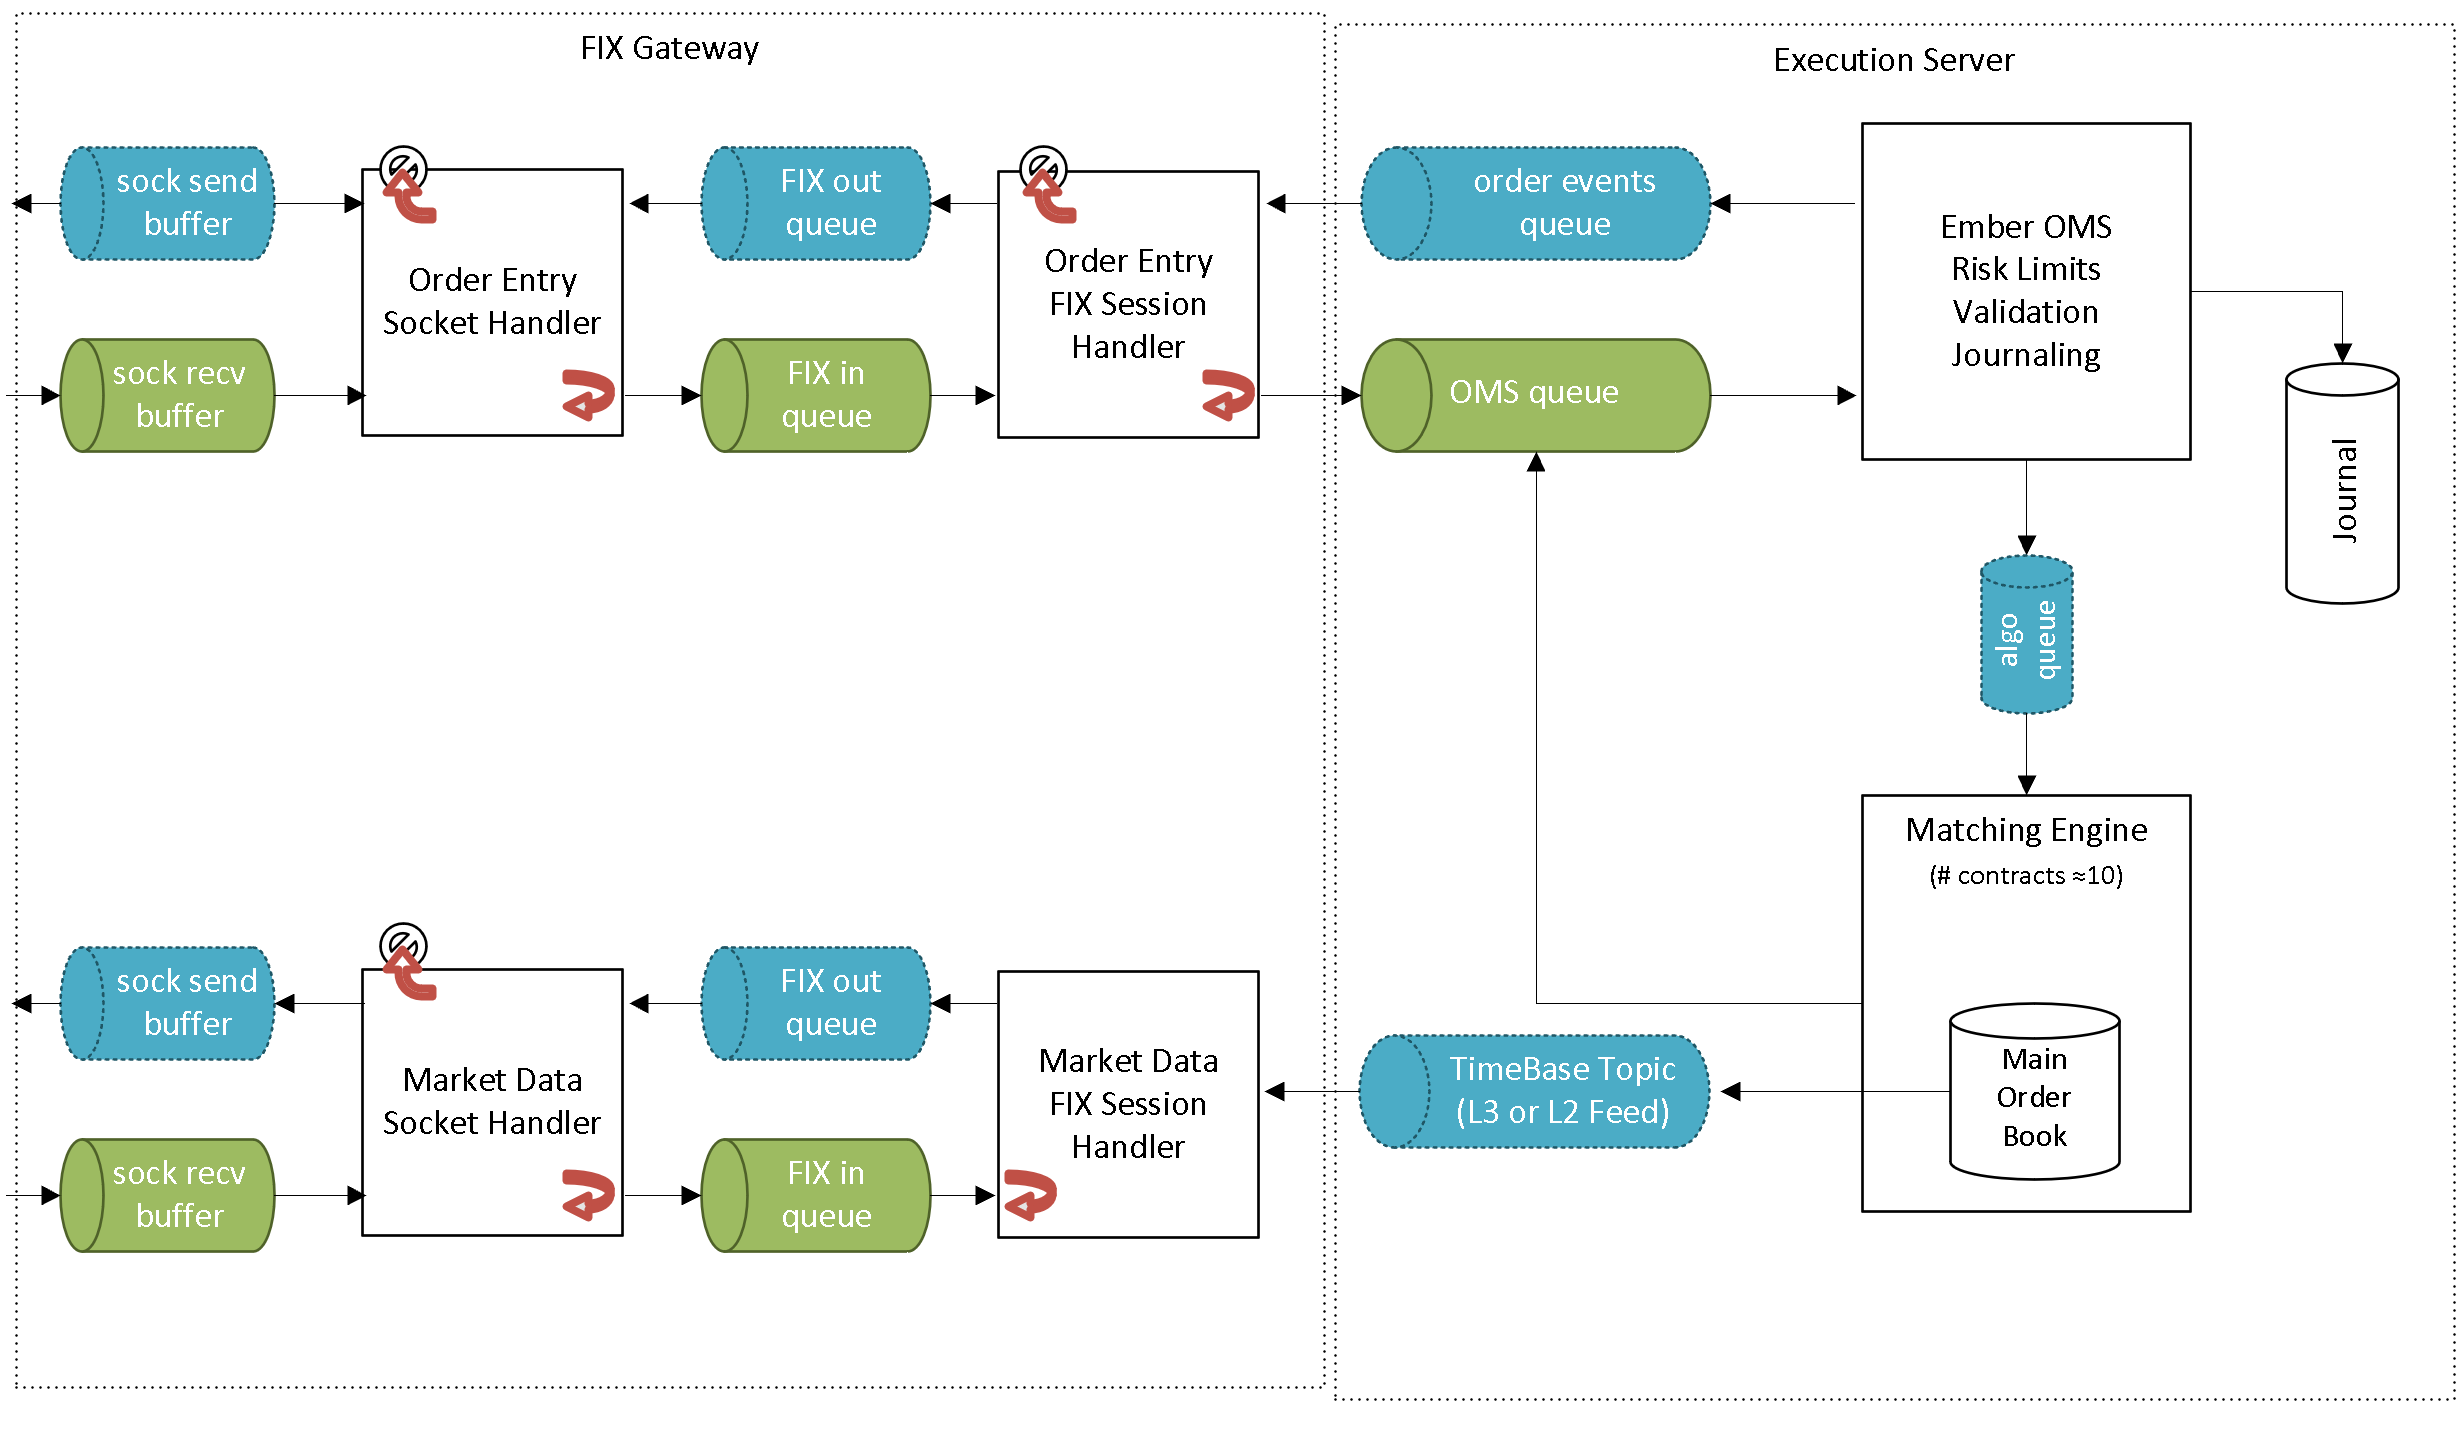
Each Market Data Gateway consists of Transport and Session components that run as separate threads and are typically assigned to specific CPU cores.
This section describes how the Session component works.
Main Logic
Market Data Gateway performs two main tasks in a repeated alternating pattern:
- Ingest - Receive market data to be published.
- Emit - Send market data to clients, one symbol at a time.
This pattern can be likened to a pump or heart, as it receives data in, then sends it out, then receives data in again, and so on.
Ingest Phase
The Ingest phase only executes if there is new data immediately available without blocking. All ingested data is grouped by symbol. The MGD tracks the market state (order book) for each symbol independently, accumulates all trades for that symbol, and tracks if specific symbols received any updates.
When the MDG decides to send data for a specific symbol, it sends the same data to all clients subscribed to that symbol.
The MDG utilizes the fact that most outbound FIX messages contain similar fragments of data that can be reused between clients. This optimizes network bandwidth usage by sending shared parts of the message only once, and the unique data for each client separately.
The MDG only sends data to subscribed clients if:
- The market data has changed since the last flush OR
- A new client was subscribed for this specific symbol
Emit Phase
During the Emit phase, the MDG picks a symbol to be sent on a round-robin basis, following a fixed order defined in the MDG configuration.
If there is too much trade data accumulated for a symbol during ingestion, that symbol's data is immediately sent (flushed) during the ingestion phase. See the messageBufferSize configuration option.
Client Message Order
To ensure fairness among all clients consuming market data, the FIX Gateway rotates consumers for a symbol on each flush. This means that the order of messages is different for each update, and all clients receive market data in a fair and balanced manner.
For example, suppose we have four FIX clients, A, B, C, & D:
- Order of messages in 1st update: A, B, C, D
- Order of messages in 2nd update: B, C, D, A
- Order of messages in 3rd update: C, D, A, B
- Order of messages in 4th update: D, A, B, C
- Order of messages in 5th update: A, B, C, D
- Etc.
The exact method used to shift the round-robin order may vary between different versions of the FIX Gateway.
Market Data Type
Deltix Market Data Gateway supports two market data feed modes:
-
Periodic Snapshots only (also "non-incremental mode) – This mode broadcasts snapshots of the order book (top N level) with a given interval (e.g. 10 milliseconds). It is optimized for simplifying client use and supporting large number of connected clients.
-
Incremental Updates and Snapshots – This mode is designed for low-latency market data dissemination and allows delivering every market data update to a smaller number of FIX clients.
Heartbeats and Client Disconnect Due to Heartbeat Timeout
The gateway uses two independent timers to manage session liveness.
Outbound Heartbeat
If no message has been sent to the client for heartbeatTimeout milliseconds, the gateway sends a Heartbeat message to keep the connection alive.
| Parameter | Default | Description |
|---|---|---|
heartbeatTimeout | 30 sec | Interval after last outbound message at which a Heartbeat is sent |
Inbound Keep-Alive
If no message has been received from the client for keepAliveTimeout milliseconds, the gateway immediately disconnects the client. No Test Request is sent — the disconnect is unconditional.
| Parameter | Default | Description |
|---|---|---|
keepAliveTimeout | 45 sec | Maximum silence from the client before the session is terminated |
Relationship Between the Two
The intended steady state is:
- The gateway sends a Heartbeat every
heartbeatTimeoutms of outbound silence. - A well-behaved client mirrors this and sends messages (including Heartbeats) frequently enough to stay within
keepAliveTimeout. - If the client goes silent beyond
keepAliveTimeout, the gateway disconnects without warning.
For this to work correctly, keepAliveTimeout should be greater than heartbeatTimeout — the defaults (30 s / 45 s) reflect this relationship.
Configuration Options
maxLevelsToPublish- Specifies the maximum number of entries (per side) to be published in Market Data Snapshot (Full Refresh, MsgType=W) or Market Data Incremental Refresh (MsgType=Y) message. Higher values result in larger snapshot message sizes and increased outbound traffic. Additionally, it may control how many entries will be stored in order book. For L2 output, it defines maximum number of levels (business level order book depth limit). For L3 output, it defines maximum number of individual quotes (business level quote count limit). This parameter is indirectly exposed to clients through validation of the MarketDepth(264) tag. This parameter is required in non-incremental mode. For incremental modeexpectedMaxBookLevelsmay be used instead, if there are no business-level requirements to limit number of levels/ quotes.
Prior to version 1.14.140 this option was applicable only for the snapshot-only market data gateway type. It was not allowed for the incremental market data gateway type.
expectedMaxBookLevels- Specifies the number of levels expected in the published order book. This value must match the order book depth recorded by the exchange (e.g. the Aggregator Data Connector settingoutputBookSize). Sets the upper cap of number of entries (per market side) that can be sent in a FIX message. Ensures the gateway does not send more entries than this limit, even if the order book contains more. This parameter is similar tomaxLevelsToPublish, but it solely limits the size of output FIX messages and output buffer allocation. UnlikemaxLevelsToPublish, this parameter does not influence MarketDepth(264) tag validation or the number of entries stored in the order book. This is a technical limit, not a business limit. While setting this to a high value (e. g., 100,000) is possible, note that excessively large snapshot (W) with such many entries are very likely to overwhelm clients.
This parameter is only available for the incremental market data gateway type.
maxInputLevels- Allows to explicitly specify the number of levels in input market data stream. Can be set only ifmaxLevelsToPublishis also set. Can't have lower value thanmaxLevelsToPublish(normally should be exactly same or higher). For L2 feeds it corresponds to price levels. For L3 feeds it corresponds to individual quotes. The provided value is used mainly for configuration validation and in some cases may reduce memory usage.
If you set this parameter, but actual input data has more levels, then the produced output of FIX gateway will be inconsistent and incorrect.
-
messageBufferSize- Specifies the size of the FIX message buffer (one per symbol). It determines the maximum size of an outbound FIX message. The buffer size controls how many trade messages can be batched together during the Ingest phase. A lower buffer size results in a higher number of FIX messages. The default size is 10 kilobytes, and values like “20K” (20 kilobytes) can be used. If the buffer size is insufficient, the “flush” happens during the “Ingest” phase and regular interval updates are broken. -
minimumUpdateInterval- Specifies the minimum time interval between two snapshots (per symbol). This option prevents too frequent snapshots. The MDG does not send new data for a symbol to clients if:- The symbol's order book was updated less than the specified number of milliseconds ago
- AND the outbound FIX message buffer is not full
If the outbound message buffer for a symbol is full during the Ingest phase, this option is ignored. This option can be set as low as 0. The default value is 10 milliseconds.
Note: In incremental mode, this parameter controls how often the MDG tries to send snapshots for any client that "needs" a snapshot. A client "needs" snapshot if:
- The client just connected and haven’t recieved any snapshots or
- The MDG had a queue overflow and missed some incremental messages, and must re-send full data set to the client. Normally, the incremental mode does NOT broadcast periodic snapshots.
Setting minimumUpdateInterval to zero may produce an order book snapshot after each incoming order book update, resulting in a high number of updates. FIX clients may not be able to handle handle such a flow, and the overall latency may become very bad. The only reasonable case when it makes sense to use a zero interval is when it's known that the inbound message frequency is low and will not overwhelm FIX clients.
-
staleMarketDataTimeout– Can be used to detect stale market data feeds (when connection seems up but no data is flowing for a data source that normally never goes quiet). This option is disabled by default.Caution: Do not set the
staleMarketDataTimeoutparameter without consulting with Deltix Tech Support first. This option may interfere with the normal operation of the MDG. For example, it may cause issues when upstream data has regular maintenance hours or an internal matching engine that doesn’t recieve many orders (in these cases, a quiet period is expected). -
sendQueueSize– Specifies the size of the send buffer of each gateway, in bytes. Shared between all clients for a gateway. The default is 32 megabytes (32M). Should be increased proportionally tosocketSendBufferSize. Should be at leastsocketSendBufferSize * numberOfFixSessions / 10. -
socketSendBufferSize– Specifies the size of the outbound socket buffer for each session. The default is 1 megabyte (1Mb). See how to calculate it. If set value is too low, clients my experience disconnects due to backpressure. However, high value increases overall app memory requirements, as that buffer allocated for each connected client.Caution: For this property to work correctly, it's necessary that sockets of that size are allowed on the OS level. So you have to set both this property in FIX gateway config and also set the OS level socket send buffer size.
Configuring OS outbound socket buffer size
To allow the FIX gateway to use the specified socketSendBufferSize, the OS socket buffer size must be set to an equal or greater value.
That can be done by setting wmem_max network kernel parameter. For example, you may want to set it to 4Mb:
sysctl -w net.core.wmem_max=4194304
Please note that these changes are temporary and will be lost after a system restart. Read up on how to make these persistent and survive OS restart.
Here is a sample of how to adjust the socket send buffer size for docker-compose when ember is not running in host networking mode:
ember:
    app: …
        sysctls:
            - net.core.wmem_max=4194304
Outbound Socket Buffer Size Calculation
socketSendBufferSize should be set to a value that is sufficient to hold all data that can be sent to a client during the interval
that corresponds to maximum latency between FIX gateway and FIX client.
That value depends on multiple factors and computation logic is different for incremental and non-incremental modes.
If you are experiencing disconnects due to backpressure (BACKPRESURE_ON_SEND error), the first thing to check is the socket send buffer size.
It's very likely that socketSendBufferSize is too small for the current load or wmem_max is lower than configured socketSendBufferSize.
Non-Incremental Mode
Here is a pseudocode example for computing the required outbound socket buffer size for non-incremental (snapshot-only) mode:
bufferTimeCapacity = {estimated maximum latency between FIX gateway and fix client. E.g. 200 ms}

symbolCount = {number of symbols distributed by the FIX gateway}

incomingMessagesPerSecond = {number of market update messages from the data source (TimeBase stream) per second}

estimatedMaxSnapshotMessageSize = 256 + 2 * 64 * maxLevelsToPublish # Estimated size of snapshot message (FIX 35=W)

messagesToBuffer = min(symbolCount * bufferTimeCapacity / minimumUpdateInterval, incomingMessagesPerSecond * bufferTimeCapacity / 1000 ms)

socketSendBufferSize = estimatedMaxSnapshotMessageSize * messagesToBuffer
Please note that this is a recommended minimum value. The optimal value is about 4x greater, depending on the use case.
Example of calculation for 1000 symbols with 5000 incoming messages per second and 200 ms latency, 100 levels, 10ms minimumUpdateInterval:
minimumUpdateInterval = 10ms
bufferTimeCapacity = 200 ms
maxLevelsToPublish = 100
symbolCount = 30
incomingMessagesPerSecond = 5000

estimatedMaxSnapshotMessageSize = 256 + 2 * 64 * 100 = 256 + 12800 = 13056

messagesToBuffer = min(30 * 200ms / 10ms, 5000 * 200ms / 1000ms) = min(600, 1000) = 600 messages

socketSendBufferSize = 13056 * 600 = 7833600 = 7650 kb ~= 7.5 Mb # Minimum buffer size
Incremental Mode
bufferTimeCapacity = {estimated maximum latency between FIX gateway and fix client. E.g. 200 ms}

incomingMessagesPerSecond = {number of market update messages from the data source (TimeBase stream) per second, maximim possible rate}

estimatedAvgMessageSize = 512 # Average size of incremental update message (FIX 35=X)

messagesToBuffer = incomingMessagesPerSecond * bufferTimeCapacity / 1000 ms

socketSendBufferSize = estimatedAvgMessageSize * messagesToBuffer
Please note that this is a recommended minimum value. The optimal value is about 4x greater, depending on the use case.
Example of calculation for 1000 symbols with 5000 incoming messages per second and 200 ms latency:
bufferTimeCapacity = 200ms
incomingMessagesPerSecond = 5000
estimatedAvgMessageSize = 512

messagesToBuffer = 5000 * 200 / 1000 = 1000

socketSendBufferSize = 512 * 1000 = 512000 = 500 kb
Capacity for initial snapshots
Additionally, socketSendBufferSize should be big enough to hold all snapshots for all symbols that a client can subscribe to at once.
Total size of all snapshots for all symbols can be calculated this way:
symbolCount = {number of symbols distributed by the FIX gateway}

estimatedMaxSnapshotMessageSize = 256 + 2 * 64 * maxLevelsToPublish

socketSendBufferSize_ForSubscribe = estimatedMaxSnapshotMessageSize * symbolCount
Example, for 20 symbols with 1000 level order books:
symbolCount = 20

estimatedMaxSnapshotMessageSize = 256 + 2 * 64 * 1000 = 256 + 128000 = 128256

socketSendBufferSize_ForSubscribe = 128256 * 20 = 2565120 = 2 500 kb ~= 2.5 Mb # Minimum buffer size
Flow Control
In case of high load, the main bottleneck for the MDG is the outbound message queue.
The MDG uses the following pressure relief approach:
- If the MDG fails to send order book data (tags 269=0 or 269=1), the message is discarded.
- If the MDG fails to send trade data (tag 269=2), the affected client gets disconnected.
In the Transport component of the MDG, a failed send attempt due to a full outbound buffer results in the immediate disconnect of a client.
Behavior on Different Load Levels
This section describes behavior of the Snapshot-only Market Data Gateway (MDG), which changes with the amount of data coming from the exchange.
The “load levels” described below are examples of MDG behavior in varying circumstances. Please keep in mind that there are no explicit “load levels” in the MDG itself.
In snapshot-only mode, the MDG publishes two types of messages: market data snapshots and trades. While market data snapshots can be throttled (the most recent message effectively describes the accurate state of the market), trades cannot be.
No Load
If there is no data from the upstream feed, the MDG runs idle. No data is sent to clients.
Counter values:
Transp.ActiveCycles ~ 0, Transp.IdleCycles > 0, Transp.SendQueueSize = 0
Low Load
Under low load, any arriving update from an exchange triggers a “flush” for the affected contract (but no more often than minimumUpdateInterval).
Counter values:
Transp.ActiveCycles-rate > 0, Transp.IdleCycles-rate > 0, Transp.SendQueueSize < sendQueueSize * 1%
Medium Load
Under medium load, regular upstream data does not cause any problems for outbound network traffic. In this mode, snapshots for each (active) contract are published every minimumUpdateInterval.
Counter values:
Transp.ActiveCycles-rate > 0, Transp.SendQueueSize < sendQueueSize * 25%, Server.MDPublishDelayBackPressure-rate = 0
High Load
Under high load, the MDG receives too many market events to push both frequent snapshots and trades to clients. In this case, the MDG sacrifices the frequency of orderbook snapshots in favor of trades. The more market data comes that in, the higher the percentage of trades of the outbound traffic and the lower the frequency of published market data snapshots.
Counter values:
Server.MDPublishDelayBackPressure-rate > 0, Server.TradePublishFailure-rate = 0; also Transp.SendQueueSize > sendQueueSize * 50%
Overload
MDG becomes overloaded when the outbound networking layer simply cannot publish all upstream trade messages. In this situation, the MDG relieves overload pressure by reducing the number of connected clients. There is no strict disconnect policy in this scenario. The overload protection policy is per contract. One or several clients subscribed to the overloaded contract can be disconnected.
Counter values:
Server.MDPublishDelayBackPressure-rate > 0, Server.TradePublishFailure-rate > 0
Example of MDG Working Cycle
Let us assume a gateway needs to publish prices for the following contracts: AAA, BBB, CCC, DDD.
The order of events could be:
“Ingest” phase 1:
- Get update #1 on BBB
- Get update #2 on AAA
- Get update #3 on DDD
- Get update #4 on AAA
- Get update #5 on AAA
“Emit” phase 1:
- Send snapshot with updates #2, #4, #5 for symbol AAA
“Ingest” phase 2:
- No new data -> skip
“Emit” phase 2:
- Send update #1 for symbol BBB
“Ingest” phase 3:
- Get update #6 on AAA
“Emit” phase 3:
- No accumulated updates for CCC -> skip
- Send update #3 for symbol DDD
“Ingest” phase 4:
- Get update #7 on DDD
- Get update #8 on CCC
“Emit” phase 4:
- We have data for AAA but we sent snapshot for it recently (less than 10ms) -> skip
- No accumulated updates for BBB -> skip
- Send update #8 for symbol CCC
“Ingest” phase 5:
- No new data -> skip
“Emit” phase 5:
- We have data for DDD but we sent a snapshot for it recently (less than 10ms) -> skip
- We have data for AAA but we sent a snapshot for it recently (less than 10ms) -> skip
- No accumulated updates for BBB -> skip
- No accumulated updates for CCC -> skip
- Nothing to do for now
...After 10ms of market inactivity...
“Ingest” phase 1001:
- No new data -> skip
“Emit” phase 1001:
- Send update #6 for symbol AAA
“Ingest” phase 1002:
- No new data -> skip
“Emit” phase 1003:
- No accumulated updates for BBB -> skip
- No accumulated updates for CCC -> skip
- Send update #7 for symbol DDD
Order Entry
Configuration Options
sendCustomAttributes– When enabled, the FIX gateway populates ExecutionReport messages with custom attributes from order events.customAttributesSet- override range of custom FIX tags supported by FIX encoders/decoders (Described later in this document)sendEmberSequence- When enabled, the FIX gateway populates ExecutionReport FIX messages with an Ember message sequence (Journal message sequence number) using tag 9998.
Trader ID Resolution
By default, the gateway uses the FIX message tag SenderSubId(50) to convey trader identity. This method follows an approach chosen by other exchanges, like CME iLink. To override this, use the traderIdResolution setting of each order entry gateway.
SENDER_SUB_ID- Uses FIX tagSenderSubId(50)to convey trader identity (default mode).SESSION_ID- Uses FIX tagSenderCompId(49)to convey trader identity.
If Trader is used as a risk projection key, the trader field is immutable — replace requests with a different SenderSubId(50) will be rejected. To allow trader modification (e.g. for CME Tag 50 workflows), enable allowReplaceTrader in the engine validation settings, but this makes the Trader projection unavailable for risk rules. See Mutable Keys.
CUSTOMER_ID– Provides a traderID with each FIX session through the Ember configuration file.DTS_DATABASE– Associates one or more CryptoCortex User IDs (GUIDs) with each session through the CryptoCortex Configurator (new since Ember 1.8.14). In this case, the FIX tagSenderSubId(50)must match with the CryptoCortex user ID (GUID). FIX Gateway validates that the order's user is indeed associated with the specific FIX session.
Example:
gateways {
  trade {
    OE1 {
      settings {
        traderIdResolution: DTS_DATABASE
        ...
Custom FIX Tags Forwarding
The FIX Order Entry gateway can be configured to pass a custom set of FIX tags for inbound/outbound FIX messages
Before version 1.14.34, the FIX Gateway passed the following custom tags:
Text(80)ExecInst(18)ClOrdLinkID(583)ContingencyType(1385)- Any tags in the 6000-8999 range
Starting with version 1.14.34, the default set of custom attributes ranges from tags 6000-8999.
Starting from version 1.14.206, default set of custom attributes also apply to outbound messages.
The set of custom tags can be customized by setting the customAttributesSet option in the configuration file:
gateways {
  trade {
    OE1 {
      settings {
        customAttributesSet: "80,1024,6000-8999"
        ...
Please note:
- If your FIX clients sends you complex orders (e.g., bracket orders), make sure to include tags
583and1385in thecustomAttributesSetoption. This covers the complexClOrdLinkIDandContingencyTypeorder parameters. - If the Text(80) tag is used to pass any important information in the FIX order message, it should also be included in the
customAttributesSetlist.
Message Transformer
The Order Entry Gateway can transform inbound order requests before they are placed into the Ember's OMS queue. This customizable logic can be used, for example, to correct an order destination.
Here is an example of a built-in transformer that modifies each order request's Destination fields based on the specified exchange.
transformer: {
  factory = "deltix.ember.service.engine.transform.CaseTableMessageTransformerFactory"
  settings {
    rules: [
      // (Destination1)? | (Exchange1)? => (Destination2)? | (Exchange2)?
      "*|DELTIXMM => DELTIXMM|DELTIXMM",
      "*|HEHMSESS1 => HEHMSESS1|HEHMSESS1",
      "*|HEHMSESS2 => HEHMSESS2|HEHMSESS2"
    ]
  }
}
See Order Request Transformer for the interface contract and how to implement a custom transformer.
User Identification
The FIX Session tag SenderCompID(49) plays a key role in identifying client messages downstream. The value of this tag becomes the Source ID of requests and the Destination ID of response messages in downstream APIs.
To maximize efficiency, the current implementation uses an ALPHANUMERIC(10) codec to convert the text value of this tag to INT64 values circulating inside the Deltix system. The maximum length of this identifier is 10 characters.
The client session identifier SenderCompID(49) must be unique across the entire system.
Typically, each client gets a pair of FIX sessions: one for Market Data and another for Order Entry. These two sessions can be hosted on the same or different FIX gateway hosts.
Client Database
The database of FIX sessions can be stored in a static configuration file or database (most traditional SQL databases are supported). Other sources can be easily implemented on request.
Security
Each FIX Session uses a dedicated port. This allows for a firewall configuration that opens each individual port to a specific source IP of FIX client (IP whitelisting). When firewall-based source IP checking is not available, valid source IPs can be specified in settings of each FIX session.
Deltix relies on a third-party SSL termination mechanism to encrypt FIX traffic, such as software solutions like stunnel or AWS NLB. An SSL layer is required for production deployments.
Client Authentication
Each FIX client must provide a password with a LOGON message to establish a new session.
Client Database FIX Gateways support a simple password checking mechanism (e.g. hashed passwords in a text file or SQL database), as well as a custom asynchronous authentication mechanism (for example, OKTA OAUTH2 provider). See the Ember Configuration Reference for more information.
OKTA authentication
Below is an example of custom OKTA authentication mechanism implemented for FIX client authentication:
gateways {
  authentication {
	 factory = deltix.ember.service.gateway.marketdata.deltix.authentication.okta.OktaAuthenticatorFactory

	 settings {
		 url = "https://dev-123456.okta.com/oauth2"
		 authorizationServer = "default"
		 loginTimeout = 20000   # in millis
		 connectTimeout = 20000 # in millis
	 }
  }
}
Logging
FIX Gateway itself does not provide a built-in ability to capture FIX logs. This was an intentional design decision. When FIX log capture is required, a specialized network packet capture solution can be used. In the simplest case, this could be software packages like tcpdump or tshark. Hardware capture (e.g. using router port mirror) can be used in high-end cases. Solutions like Amazon Traffic Mirroring can also be useful. For more information, see the appendices at the end of this document.
November 2021 Update: Deltix now provides a specialized Docker container called fix-logger that can capture FIX messages for given server port(s). FIX messages are dumped to the console output and can be redirected to the log aggregator of your choice. Default implementation provides support for Graylog. For more information, see Appendix A.
Performance
System performance characteristics depend on a lot of factors, including:
- The number of connected FIX clients.
- User activity patterns - Aggressive traders put a lot of stress on trading event backflow, while passive traders lead to a very deep order book and potentially increase market data events backflow.
- Network bandwidth - Under some loads, the FIX gateway can consume the entire network bandwidth whether its 1G or 10G.
- CPU Speed - Formatting and parsing FIX messages is fairly CPU intensive. Matching Engine and Execution Algorithms can also be CPU intensive.
- Disk Speed (Journal recording speed).
Current benchmark results are available as separate documents. Deltix is constantly working on performance optimization of FIX Gateway and core downstream modules.
Ballpark numbers: The Dell PowerEdge R630 Server should be able to serve about 500 actively trading FIX users (assuming each user generates a trading flow of 250 requests per second and receives back 2-5 events per request). All flows are optimized for low latency rather than high throughput. The FIX to FIX pass through latency of FIX Gateway is measured in single digit microseconds.
Scalability
Vertical Scalability
FIX Gateway supports a set of connections by using two CPU cores: one for the transport level and another for the FIX session level and encoding/decoding. Multiple instances of FIX gateway can be launched on a single server, providing there are enough hardware resources.
Horizontal Scalability
FIX Gateway uses the Deltix TimeBase and Aeron UDP messaging framework to communicate via a high throughput / low latency UDP network protocol with downstream services like Deltix OMS, Matching Engine, or execution algorithms. Multiple FIX gateway servers can be employed to share client load.
Overload Protection (Flow Control)
Under severe load, FIX Gateway takes protective measures. The system attempts to reduce the amount of additional work entering it. For example, if the downstream system is overloaded, the FIX Session layer starts rejecting inbound order requests.
High Availability
FIX Gateway is stateless. In the event of server failure, FIX clients can reconnect to a backup server.
Monitoring
FIX Gateway publishes performance counters that can be monitored using various tools.
As a reference, Deltix provides integration with Zabbix. Zabbix allows charting vital metrics and setup alerts. Other monitoring systems can be supported on user request. More information about monitoring can be found in the Monitoring Ember Metrics document.
Some counters are described in Appendix C: Monitoring Counters.
Ember Monitor
The Ember Monitor web-app has several panels described in the sections below.
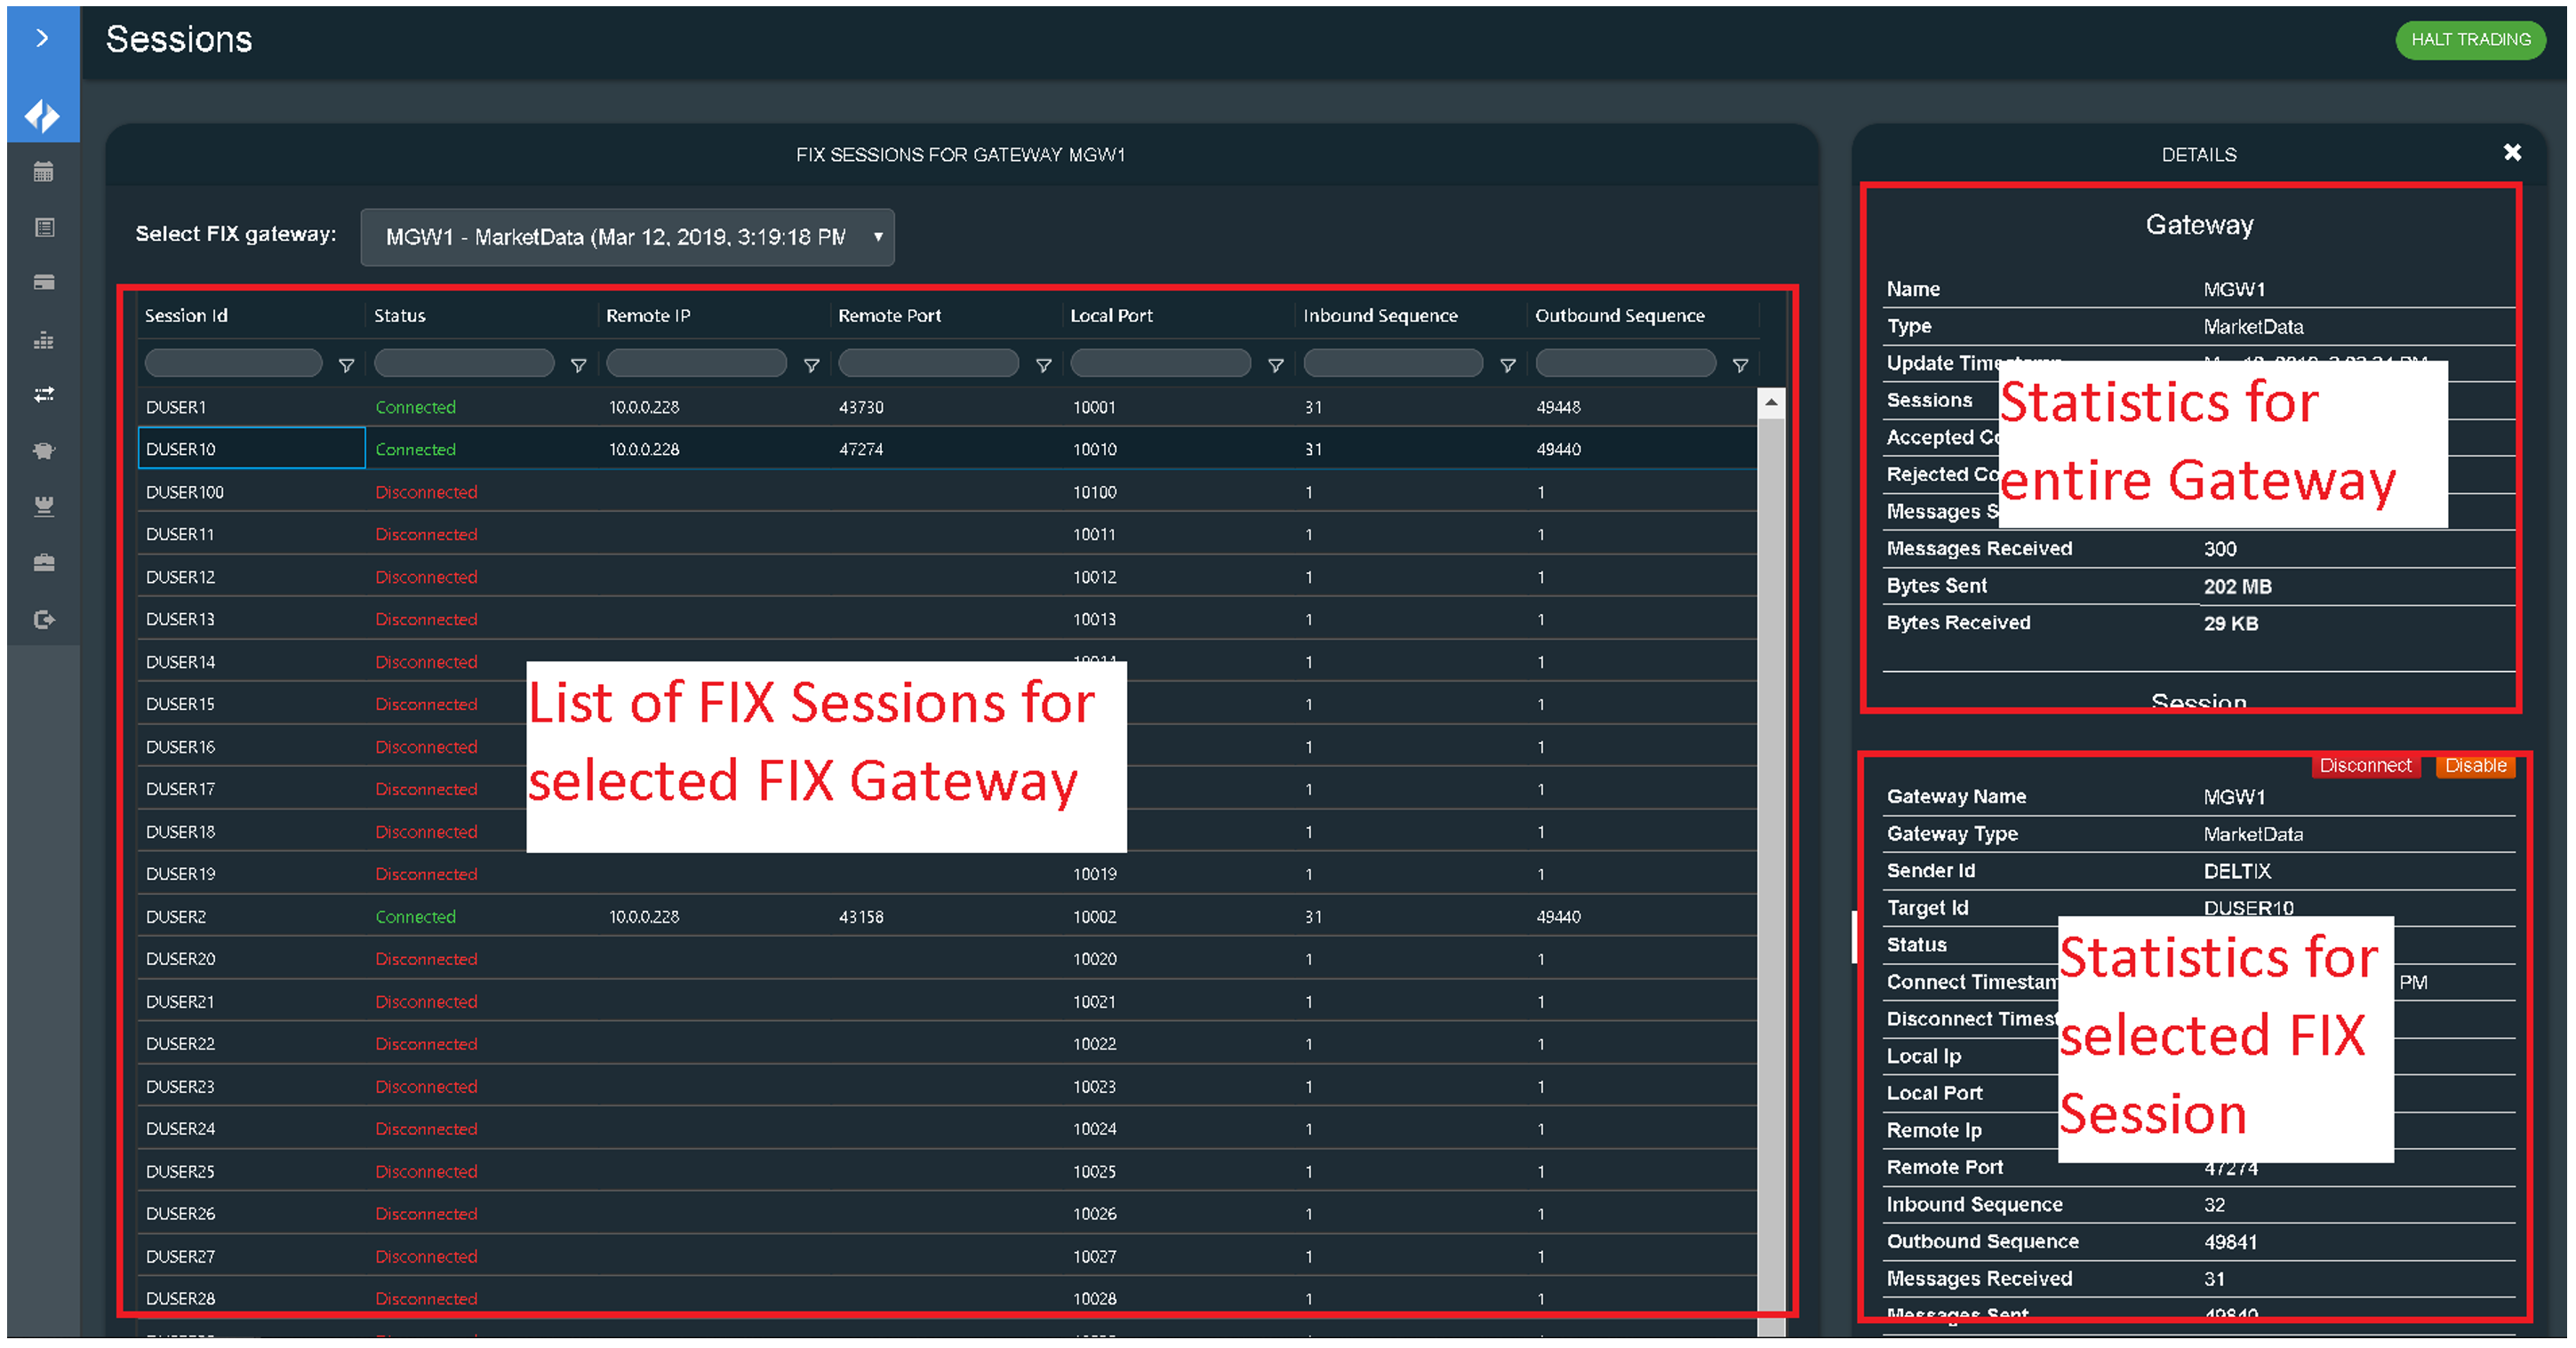
FIX Sessions
The FIX Sessions panel allows operators to perform the following actions:
- Select a FIX gateway
- See information about each session
- Aggregate statistics about the whole gateway
Operators can disconnect or enable/disable the selected FIX Session.
Orders & Trades
On the Orders and Trades panels, operators can inspect the details of specific orders, and cancel or discard orders if necessary.
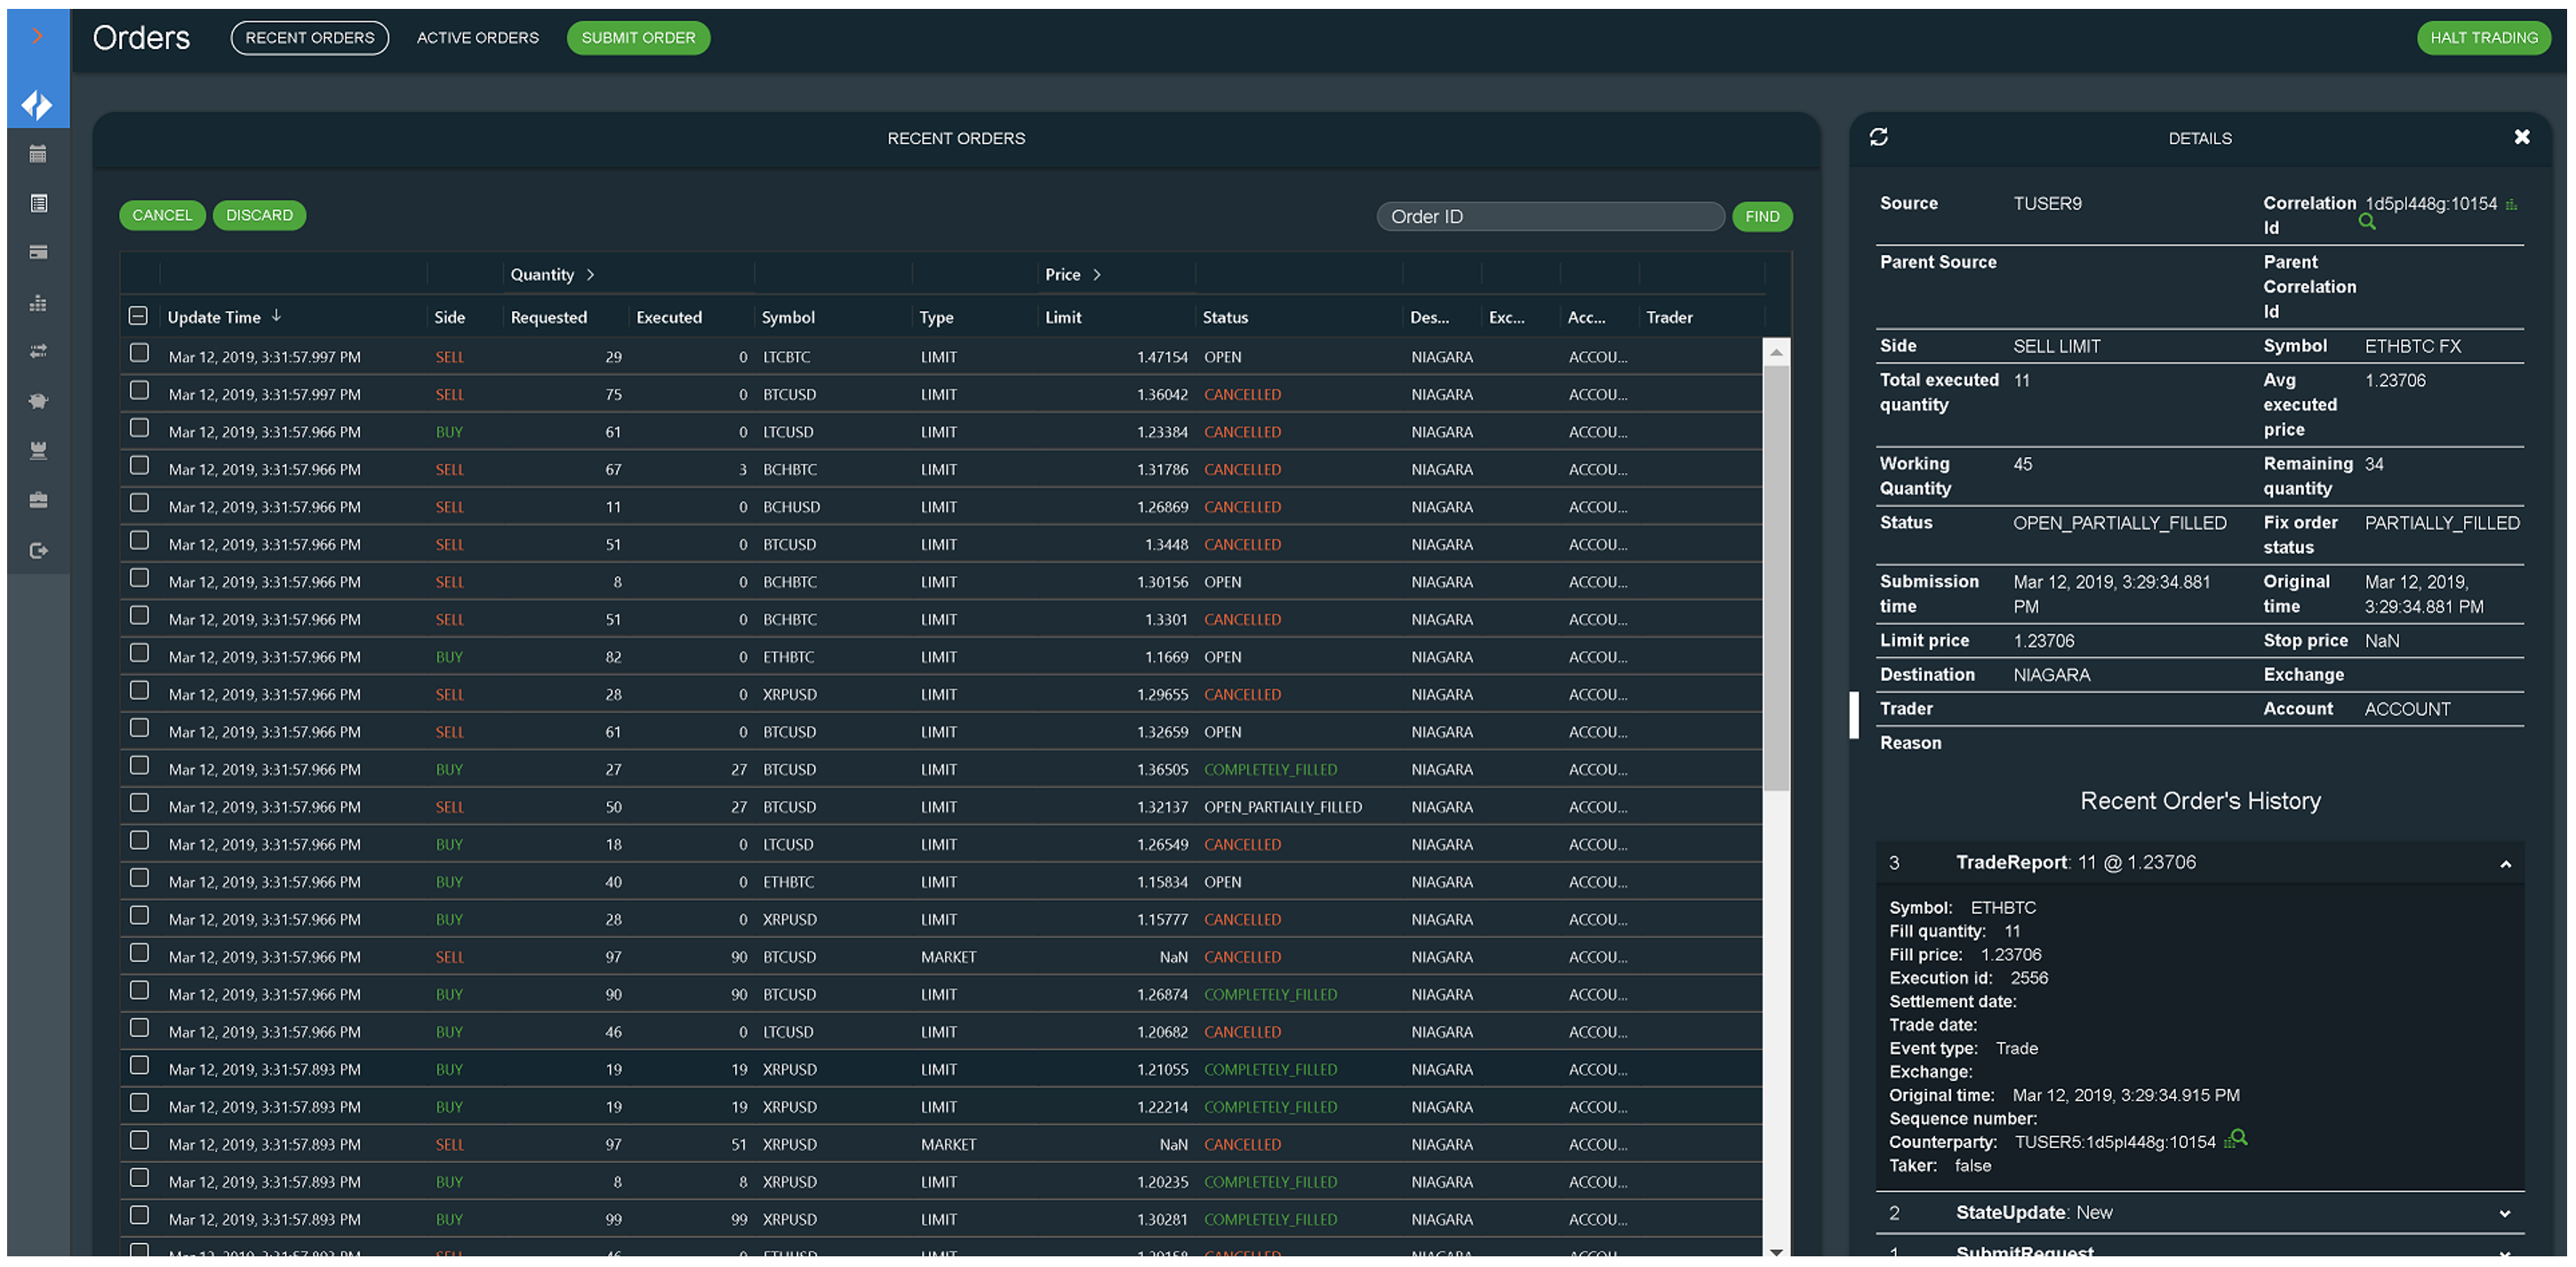
Kill Switch
The Ember Monitor has a kill switch in the form of a Halt Trading button, located in the upper right corner. When activated, this button automatically rejects all new order requests.
Appendix A: FIX Traffic Capture
Capture using FIX Logger utility
FIX-logger is a tool for capturing messages from FIX sessions and logging their contents in text form either to standard output or to Graylog. It captures multiple sessions (unencrypted, TCP) connected to a single specified host and provides some additional data that can be useful with debugging, such as src/dst IP addresses, timestamps and total packet statistics. The application can be also used to extract FIX sessions from packet capture (.pcap) files.
FIX-logger currently supports mainstream x86-64 Linux systems, including MUSL-based (Alpine Linux). arm64, Mac OS support is possible, but not currently distributed.
Quick tool usage example
Here we capture FIX sessions that are bound to TCP port range 7001-7100 using network interface eth0:
docker run --network host --rm -it registry.deltixhub.com/deltix.docker/fix-tools/fix-logger-alpine:0.6.5 --device=eth0 --ports=7001-7100
Tool arguments
--helpwill print version, some usage examples, brief parameter description and exit.--list- list capture devices.--silent,-s- no logging. May be useful when processingstdoutwithout filtering.--verbose,-v- extra logging.--device=- specify capture device. Mandatory parameter, unlesspcapfilename is used instead. You can use either device name or integer index as argument.--host=provide FIX server address. Address or at least port range are mandatory to obtain usable output.- Should contain IP4 address and/or port(s), separated by
: - If IP4 part is omitted,
:is still mandatory - If port/port list is not specified, it should be provided via
--portargument - Few valid example values:
10.10.1.234,192.168.1.10:8000-8099,:2000-2003,3000-3009,8888
- Should contain IP4 address and/or port(s), separated by
--port=/--ports=- specify port(s) (see below) separately from host address.--port=1224has the same meaning as--host=:1234. Mandatory, if port list is not specified elsewhere.--console-mode=- specifystdoutoutput header format. Possible choices: extended.briefif the default mode. Examples below:2023-06-12 09:09:05.137213,OUT,8=FIX.4.4|9=...- brief[2023-06-12 09:09:05.137213 SESSION: 1 DIR: OUT (10.0.1.181:10002->10.0.1.124:59686)]- extended. FIX message starts from the next line.
--interactive,-i- enable raw keyboard processing. Can use keys like Esc or Enter. Otherwise, can only terminate the program with Ctrl-C or SIGINT/SIGTERM signals. Older versions used interactive mode by default.--pcap-thread-affinity=<CPU list>- pin the main worker thread to the specified CPUs--worker-thread-affinity=<CPU list>- pin the UI thread to the specified CPU--gelf-tcp=- address and port for Graylog server. TCP/GELF input is expected. Examplegraylog.my-company.com:4321. See Graylog output above.--gelf-no-timestamp- do not set actual capture timestamp in the messages output to Graylog.--mt-mode=- Multithreading mode. Integer value [0..2]. The application can use 1 or 2 threads to process the data. When operating in a docker container, it often makes sense to use--mt-mode=1to switch into single-threaded mode. Single-threaded mode is also always used when processing pcap files offline. Otherwise, this parameter exists for troubleshooting/debugging.
Where a port list is a list of comma-separated port numbers or ranges. Example: 1000-1003,1005,1009,1100-1110
CPU list is a list of comma-separated CPU indices or ranges, starting from 0. Example: 0-3,8
Tool limitations
- The tool expects TCP/IP packet stream without losses and retransmissions, otherwise the received FIX messages can be malformed, warning or errors will be displayed in such situation.
- VLAN tags probably won't work
- WiFi capture likely won't work
- IPv4 only, no support for IPv6 yet
- Use IP address, not hostname, when specifying FIX server network address. This is to avoid ambiguity that may be caused by DNS resolution.
FIX logger running as Kubernetes Pod
To capture traffic on port 9001 and send the captured messages to Graylog, use the following example Kubernetes pod:
        - name: fix-logger
          image: >-
            registry.deltixhub.com/deltix.docker/fix-tools/fix-logger-alpine:0.6.5
          command:
            - /bin/sh
            - '-c'
            - >-
              /fix-logger --device=eth0 --port=9001 --host=$(POD_IP) -v
              --mt-mode=1 --gelf-tcp=monitoring-graylog.monitoring:12201
          env:
            - name: POD_IP
              valueFrom:
                fieldRef:
                  fieldPath: status.podIP
            - name: CONTAINER_NAME
              value: fix-logger
          resources:
            limits:
              cpu: 500m
              memory: 512Mi
            requests:
              cpu: 500m
              memory: 512Mi
          terminationMessagePath: /dev/termination-log
          terminationMessagePolicy: File
          imagePullPolicy: IfNotPresent
Note:
-vprovides verbose output to the console, but it is likely not needed.
Capture using tcpdump
Given that each client connection utilizes a unique port, it's easy to capture messages between the FIX Gateway and a specific client connected on a known port.
To capture traffic for port 10011 and network interface ens3, use the following example:
tcpdump -A -i ens3 port 10011 -w capture.pcap
Capture using tshark
Tools like tshark and wireshark have support for FIX Protocol. Find a good tshark tutorial to customize recordings to your specific needs.
A basic example is:
tshark -l -n -i ens3 -t ad -R 'fix.SenderCompID == "DELTIX" or fix.TargetCompID == "DELTIX"' -f 'port 10011' -V
Sample output:
Financial Information eXchange Protocol
    BeginString (8): FIX.4.4
    BodyLength (9): 0327
    MsgType (35): 8 (EXECUTION REPORT)
    SenderCompID (49): DELTIX
    TargetCompID (56): MAKER1
    SendingTime (52): 20190311-17:34:41.075
    MsgSeqNum (34): 2
    SenderSubID (50): 9C8217B5-4E36-4D2D-822C-A71E22154044
    Account (1): SingleOrderTest
    AvgPx (6): 0
    ClOrdID (11): 7379694062678251088
    CumQty (14): 0
    ExecID (17): 1552312318433
    ExecInst (18): M (MID PRICE PEG)
    HandlInst (21): 1 (AUTOMATED EXECUTION ORDER PRIVATE NO BROKER INTERVENTION)
    OrderQty (38): 1
    OrdStatus (39): 8 (REJECTED)
    OrdType (40): P (PEGGED)
    Side (54): 1 (BUY)
    Symbol (55): BTCUSD1
    Text (58): Order symbol is not defined in Security Metadata database
    TimeInForce (59): 1 (GOOD TILL CANCEL)
    TransactTime (60): 20190311-17:34:41.074
    ExecBroker (76): OMEGADARK
    ExecType (150): 8 (REJECTED)
    LeavesQty (151): 0
    SecurityType (167): FOR (FOREIGN EXCHANGE CONTRACT)
    CheckSum (10): 019 [correct]
        [Good Checksum: True]
        [Bad Checksum: False]
This example captures traffic on port 10011 and network interface ens3. It filters messages where either the SenderCompID or TargetCompID is "DELTIX". The -V flag prints verbose output to the console.
The output includes various fields like MsgType, SenderCompID, TargetCompID, SendingTime, MsgSeqNum, and so on. The values of these fields can be used to analyze FIX traffic for specific purposes.
For example, the sample output above shows an execution report that was rejected due to an unknown order symbol.
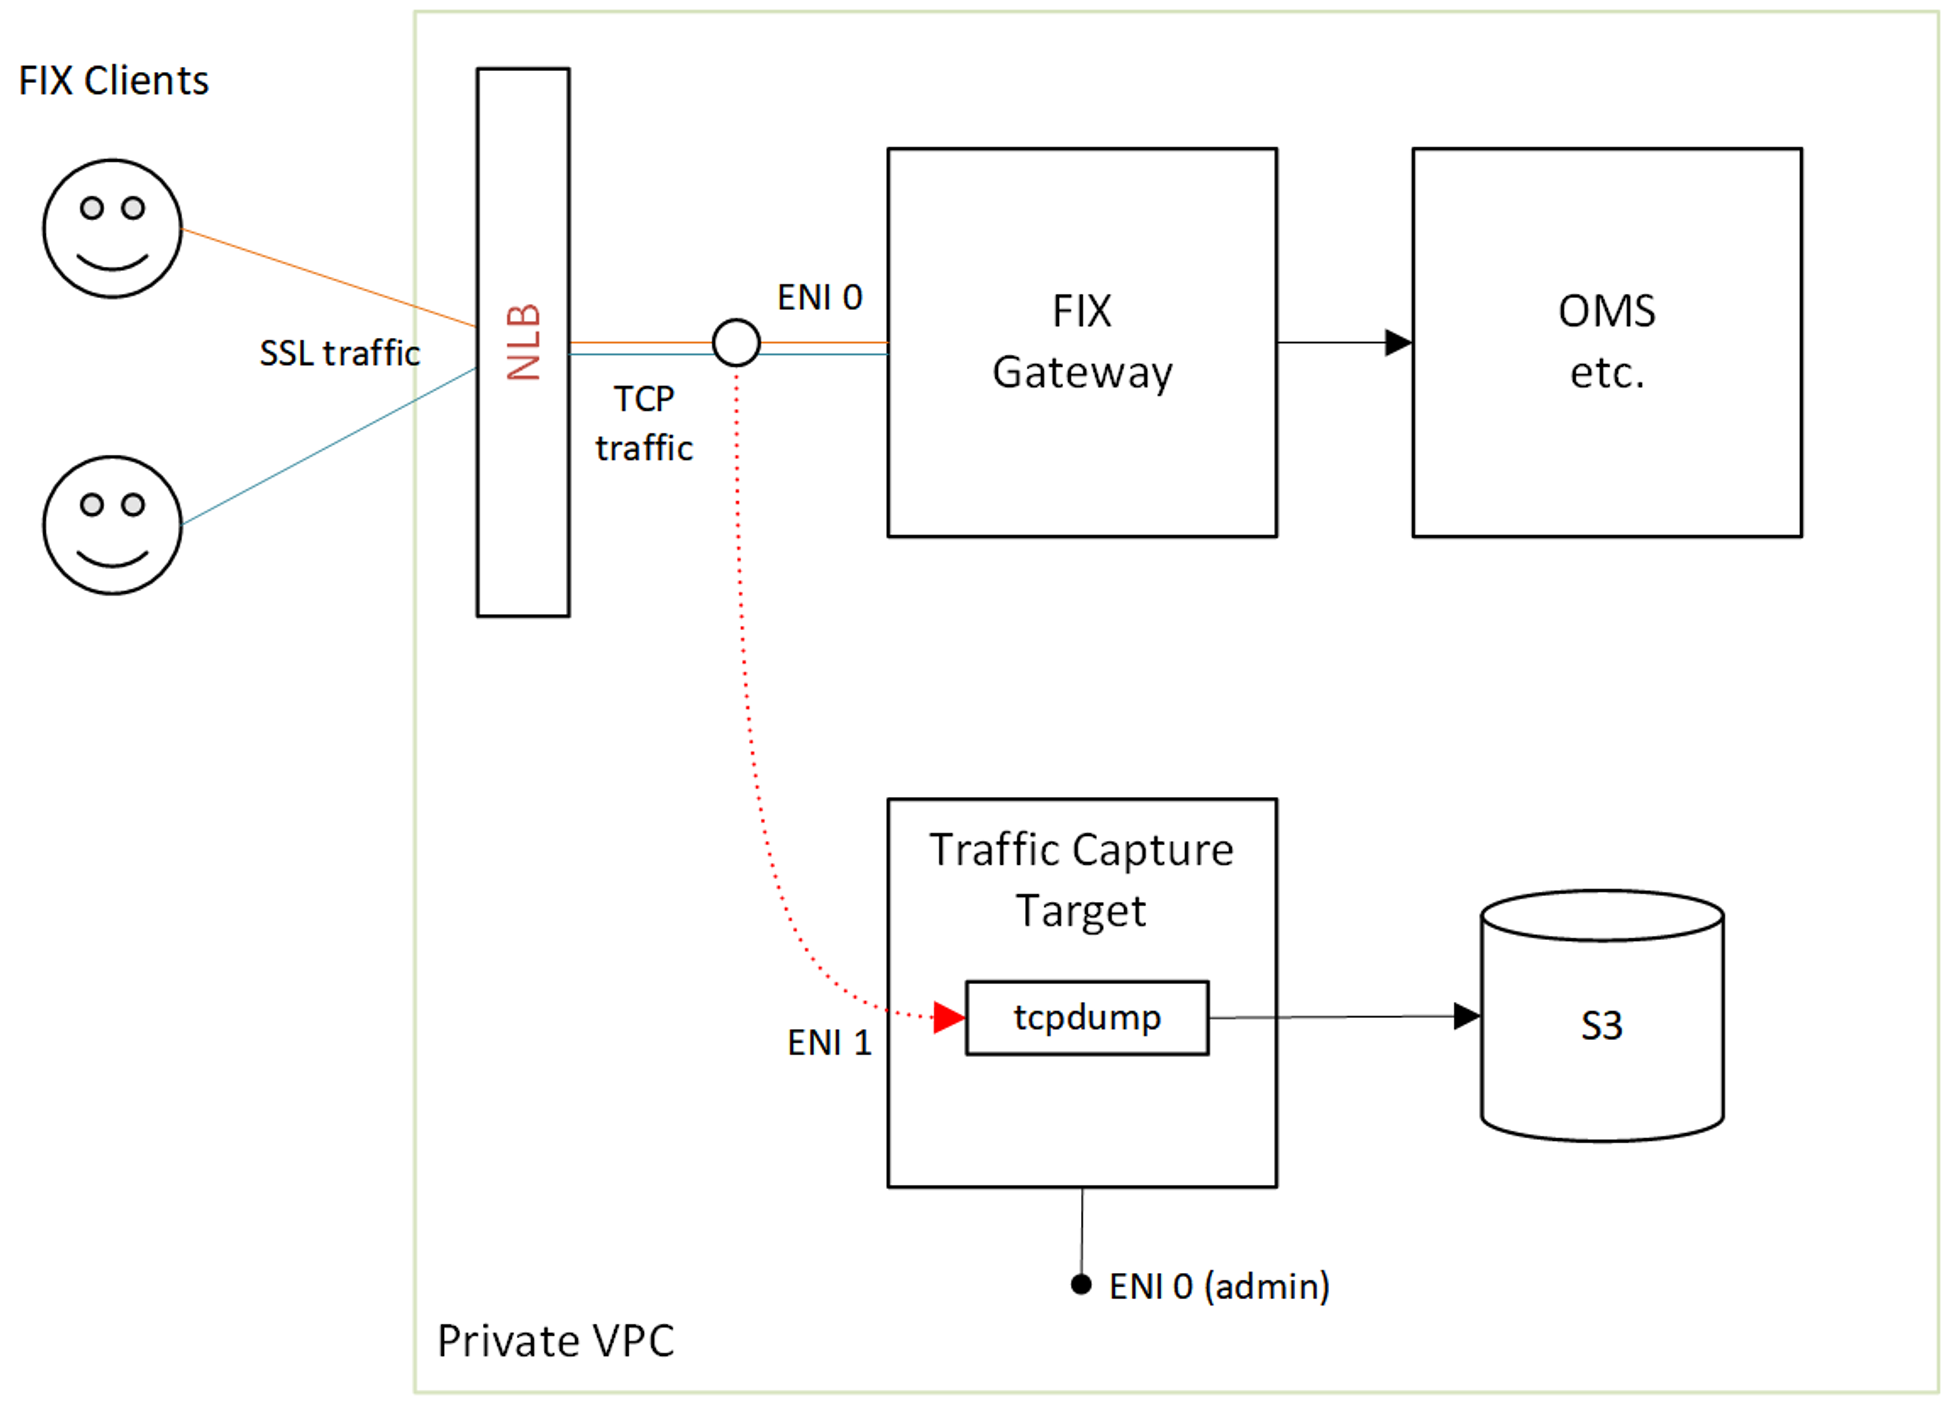
Appendix B: FIX Log Capture using AWS Traffic Mirroring
When FIX Gateway is hosted on AWS, you can use Traffic Mirroring to capture FIX logs. With Traffic Mirroring, you can mirror FIX traffic using user-controlled filters and copy it to the network interface of another host.
Setup instructions
To set up FIX log capture using AWS Traffic Mirroring, follow the steps outlined in steps 1-5 below.
Step 1: Create a FIX Log Monitoring Instance
To create an instance that is used as a traffic target, follow these steps:
-
Configure two network interfaces for the instance:
eth0for administrative trafficeth1for traffic capture
Note: We recommend assigning the name "FIX Gateway Mirror Target" to network interface
eth1for clarity. -
Use
m5.xlargerunning Amazon Linux 2 for the instance. -
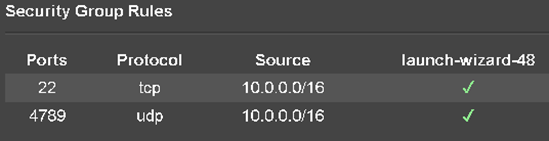
For security purposes:
- Do not assign a public IP to this instance.
- The Security Group for this instance must allow VXLAN Traffic (UDP Port 4789):
Once the instance is created, connect to it via SSH and enter the following command:
$ ip a
You should see output similar to the following:
1: lo: <LOOPBACK,UP,LOWER_UP> mtu 65536 qdisc noqueue state UNKNOWN group default qlen 1000
    link/loopback 00:00:00:00:00:00 brd 00:00:00:00:00:00
    inet 127.0.0.1/8 scope host lo
       valid_lft forever preferred_lft forever
    inet6 ::1/128 scope host
       valid_lft forever preferred_lft forever
2: eth0: <BROADCAST,MULTICAST,UP,LOWER_UP> mtu 9001 qdisc mq state UP group default qlen 1000
    link/ether 06:3c:5f:2c:ad:74 brd ff:ff:ff:ff:ff:ff
    inet 10.0.0.227/24 brd 10.0.0.255 scope global dynamic eth0
       valid_lft 2366sec preferred_lft 2366sec
    inet6 fe80::43c:5fff:fe2c:ad74/64 scope link
       valid_lft forever preferred_lft forever
3: eth1: <BROADCAST,MULTICAST,UP,LOWER_UP> mtu 9001 qdisc mq state UP group default qlen 1000
    link/ether 06:74:e5:1b:b3:fc brd ff:ff:ff:ff:ff:ff
    inet 10.0.0.223/24 brd 10.0.0.255 scope global dynamic eth1
       valid_lft 2545sec preferred_lft 2545sec
    inet6 fe80::474:e5ff:fe1b:b3fc/64 scope link
This output confirms that both network interfaces are up and running.
Step 2: Define a Mirror Target
To define a new Mirror Target, go to the VPC Console and select the eth1 interface of the of newly created instance.
Give clear names to the interfaces to avoid confusion.

Step 3: Define a Traffic Mirror Filter
Next, define a traffic mirror filter to capture the traffic that we want. Typically, a FIX gateway allocates a single port for each client, and each gateway reserves port ranges for existing and future clients. In this step, we define separate rules for market data and order entry port ranges.
Use the filter wisely and avoid sending too much traffic to the target machine.
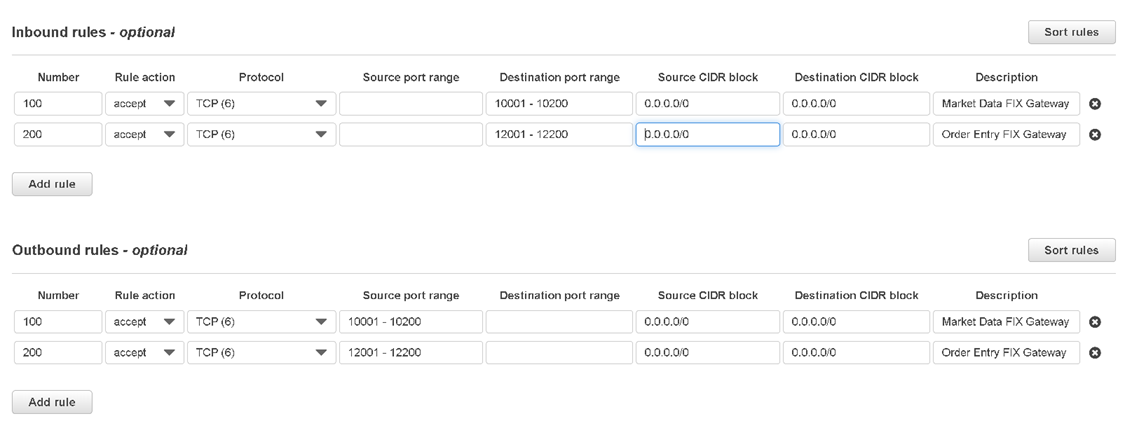
As shown in the diagram below, inbound traffic is limited to destination ports 10001-10200 and 12001-12200, which correspond to the port ranges of the Market Data and Order Entry gateways in our system. Note that the capture filter is not a firewall ACL and captures traffic coming from anywhere (0.0.0.0/0).
Step 4: Traffic Mirror Session
For the final step, we need to associate our traffic source with a traffic target and use the filter we defined in the previous step.
Make sure to use a network interface used by FIX Gateway instance as a traffic source.
Step 5: Quick test
Run tcpdump on the traffic capture host to make sure that everything works:
$sudo tcpdump -A -i eth1
…
.]=..\]C8=FIX.4.4.9=0790.35=W.49=DELTIX.56=DUSER173.52=20190930-21:11:51.955.34=6460833.262=16.55=XRPUSD.167=FOR.268=22.269=2.270=1.26886.271=6.5797=1.269=2.270=1.28393.271=2.5797=1. 269=2.270=1.29548.271=17.5797=1.269=2.270=1.29943.271=13.5797=1.269=2.270=1.30947.271=4.5797=1.269=2.270=1.31833.271=17.5797=1.269=2.270=1.29351.271=8.5797=1.269=2.270=1.31833.271=8. 5797=1.269=2.270=1.31945.271=44.5797=1.269=2.270=1.31946.271=31.5797=1.269=2.270=1.31946.271=30.5797=1.269=2.270=1.31953.271=54.5797=1.269=2.270=1.2306.271=3.5797=2.269=2.270=1.25386 .271=56.5797=2.269=2.270=1.25874.271=32.5797=1.269=2.270=1.29855.271=4.5797=1.269=2.270=1.29391.271=34.5797=2.269=2.270=1.29391.271=42.5797=2.269=2.270=1.28673.271=16.5797=2.269=2.27 0=1.28119.271=24.5797=1.269=2.270=1.28119.271=1.5797=1.269=2.270=1.29855.271=32.5797=1.10=049.8=FIX.4.4.9=1011.35=W.49=DELTIX.56=DUSER173.52=20190930-21:11:51.956.34=6460834.262=9.55 =BTCUSD.167=FOR.268=29.269=2.270=1.29851.271=7.5797=1.269=2.270=1.28556.271=37.5797=2.269=2.270=1.28556.271=5.5797=2.269=2.270=1.27559.271=17.5797=2.269=2.270=1.29851.271=61.5797=1.2
…
The most common errors include:
- Using the wrong network interfaces
- Using an incorrect capture filter
- Not allowing VXLAN traffic in the security group of the capturing instance
Further steps
Note that captured traffic will have some additional TCP headers (VXLAN overlays).
Advanced topics:
- Maximum packet size is 8946 bytes.
- AWS prioritizes production traffic (a normal amount of traffic) over mirrored traffic. In the case of network congestion, mirrored traffic can be delayed (and dropped).
- There are some Amazon Marketplace solutions available for reporting and analyzing captured traffic.
- Amazon allows routing mirrored traffic to a network load balancer and using auto-scaling for monitoring instances.
A good AWS traffic mirroring video can be found here.
Appendix C: Monitoring Counters
This section provides a brief list of metrics that are useful when monitoring overloads. For a complete list of monitoring metrics see Monitoring Ember Metrics.
Common metrics (for MarketDataGateway and TradeGateway) published to Ember Monitor include:
- Transp.IdleCycles - The number of times when the transport thread finishes its execution cycle with zero work done.
- Transp.ActiveCycles - The number of times when the transport thread finishes its execution cycle with non-zero work done.
- Transp.ActiveTime - The total time spent on work on the transport layer. This metric must be enabled by the gateway configuration option
measureActiveTime= "true". It is turned off by default because it callsSystem.nanoTime()each time when we switch between active and idle states. It is not recommended to turn on this counter on if you use more than one MDG in same Ember instance. - Transp.SendQueueSize - The maximum observed size of the outbound queue over 1-second interval on the side of the consumer (transport layer).
MarketDataGateway-specific metrics:
- Server.MDPublishDelayBackPressure – This metric reports the number of times the MDG delayed sending market data to clients due to back pressure (when outbound message queue is at least half full). If you observe growth in this metric, then the Market Data Gateway is unable to send data as fast as it is configured (see the
minimumUpdateIntervalsetting). - SubsWaitingForSnapshotAdded - Number of times when incremental subscriptions over all symbols started to wait for snapshot (because they are just subscribed or got affected by backpressure)
- SubsWaitingForSnapshotRemoved - Number of times when incremental subscriptions over all symbols stopped to wait for snapshot (because the client unsubscribed or snapshot was sent)
- SubsForcedToWait - Total number of events when a subscription got switched into "waiting for snapshot state" because of backpressure