Monitoring Ember Metrics
Overview
This document describes how Ember can be monitored using popular tools Prometheus, Grafana, and Zabbix.
- Prometheus open-source monitoring software.
- Grafana is open source time-series data analytics software.
Installation and initial configuration of Prometheus and Grafana are out of scope for this document.
Operations team should monitor vital system metrics like amount of free disk, and memory, system error log, etc.
Ember publishes custom metrics that can help monitor system performance and health. Each Ember server publishes its metrics (also known as “performance counters”) into local file in custom binary format (using shared memory).
REST API endpoint for Prometheus metrics export is available at https://emberhost:8988/actuator/prometheus
Ember Monitor has endpoint to export these metrics into Prometheus. See Ember Monitor Configuration Guide on how enable this feature.
Recommended Metrics to Monitor
Full set of metrics can be found at the end of this document. Here we will mention some key metrics related to error and overload.
Each deployment may be different, but consider to monitoring the following important Ember metrics.
Error counting metrics
Ember_Errors– general system error counter (non-zero value is reason for concern)Ember_Rejects– rejected orders counter (sharp increase is a bad sign)Ember_KillSwitch– system or operator halted tradingEmber_RiskVetos– count risk limit violations (sharp increase is a bad sign)Ember_UnknownOrderEvents– counts flow related to orders unknown to Ember OMSTradeConnector_Status– signals loss of connectivity to Order Entry connector.ImboundSegmentMissesMessageBus_Trasp_OutboundBackPressureDisconnectsMessageBus_Trasp_InboundBackPressureDisconnectsUnknownOrderEventsthis counter is incremented each time Ember receives event about order which is unknown (cannot be found in active/recent-inactive cache). Ember logs warnings like the following for the first maxInactiveUnknownWarningsToLog occurrences of this problem: "Ignoring OrderCancelEvent from TFIX for inactive or unknown order 12345". We suggest checking event source to determine nature of these unknown orders.
Overload metrics
Ember uses efficient in-memory queues to transmit signals between OMS and order destinations like Algorithms and Trade Connectors.
"... When in use, queues are typically always close to full or close to empty due to the differences in pace between consumers and producers. They very rarely operate in a balanced middle ground where the rate of production and consumption is evenly matched." Source
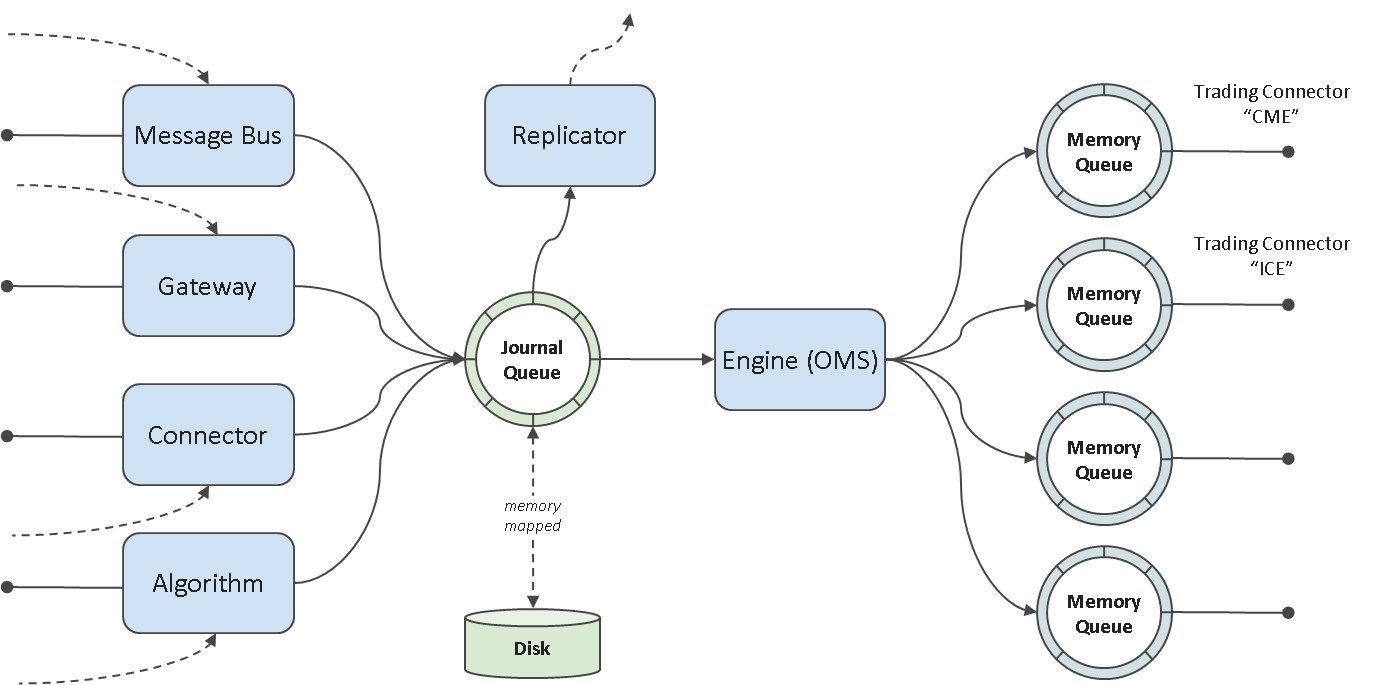
OMS
InboundFailedOffers- Signals main Ember Journal Queue back-pressure.TradeConnector.id.OutboundFailedOffers- Number of unsuccessful writes to OMS event queue. Non-zero value indicates OMS overload (message queue overflow).Algorithm.id.OutboundFailedOffers- Number of unsuccessful writes to OMS event queue. Non-zero value indicates OMS overload (message queue overflow).MessageBus.Transp.OutboundBackPressureDisconnects- Counts Message bus client disconnects due to pressure on send.MessageBus.Transp.InboundBackPressureDisconnects- Counts Message bus client disconnects due to pressure on receive (usually accompanied byInboundFailedOfferscounter).MessageBus.InboundFailedOffers-
Algorithm or Connector
Algorithm.id.InboundFailedOffers- Number of unsuccessful writes to Algorithms’s request Queue. Non-zero value indicates algorithm overload (message queue overflow). For example,Algorithm.MM.InboundFailedOfferscounter may indicate MM (MarketMaker) algorithm overload.TradeConnector.id.InboundFailedOffers - Number of unsuccessful writes to Connector’s request Queue. Non-zero value indicates connector overload (message queue overflow).
In addition, if you use FIX Gateway, read-up on overload metrics in FIX Gateway Administrator’s Guide.
Prometheus
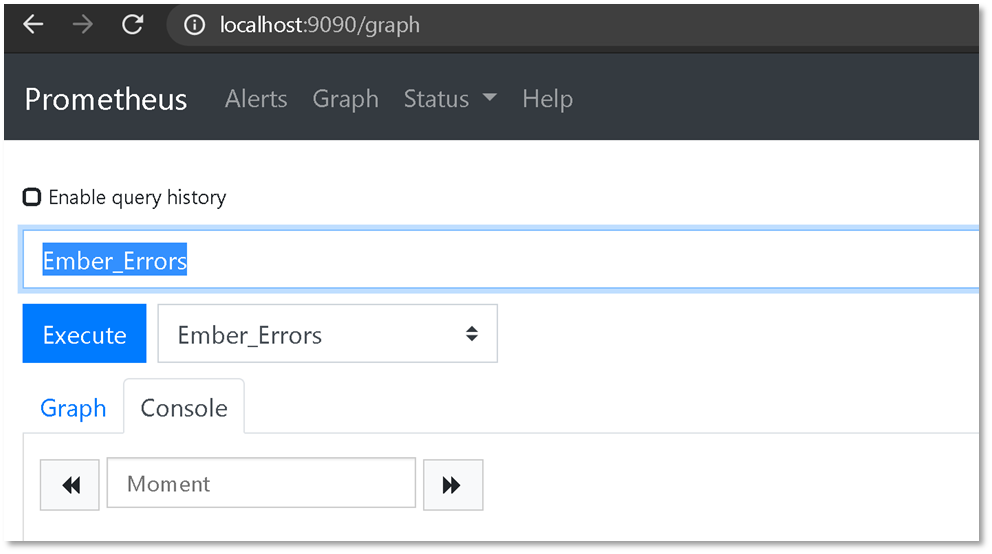
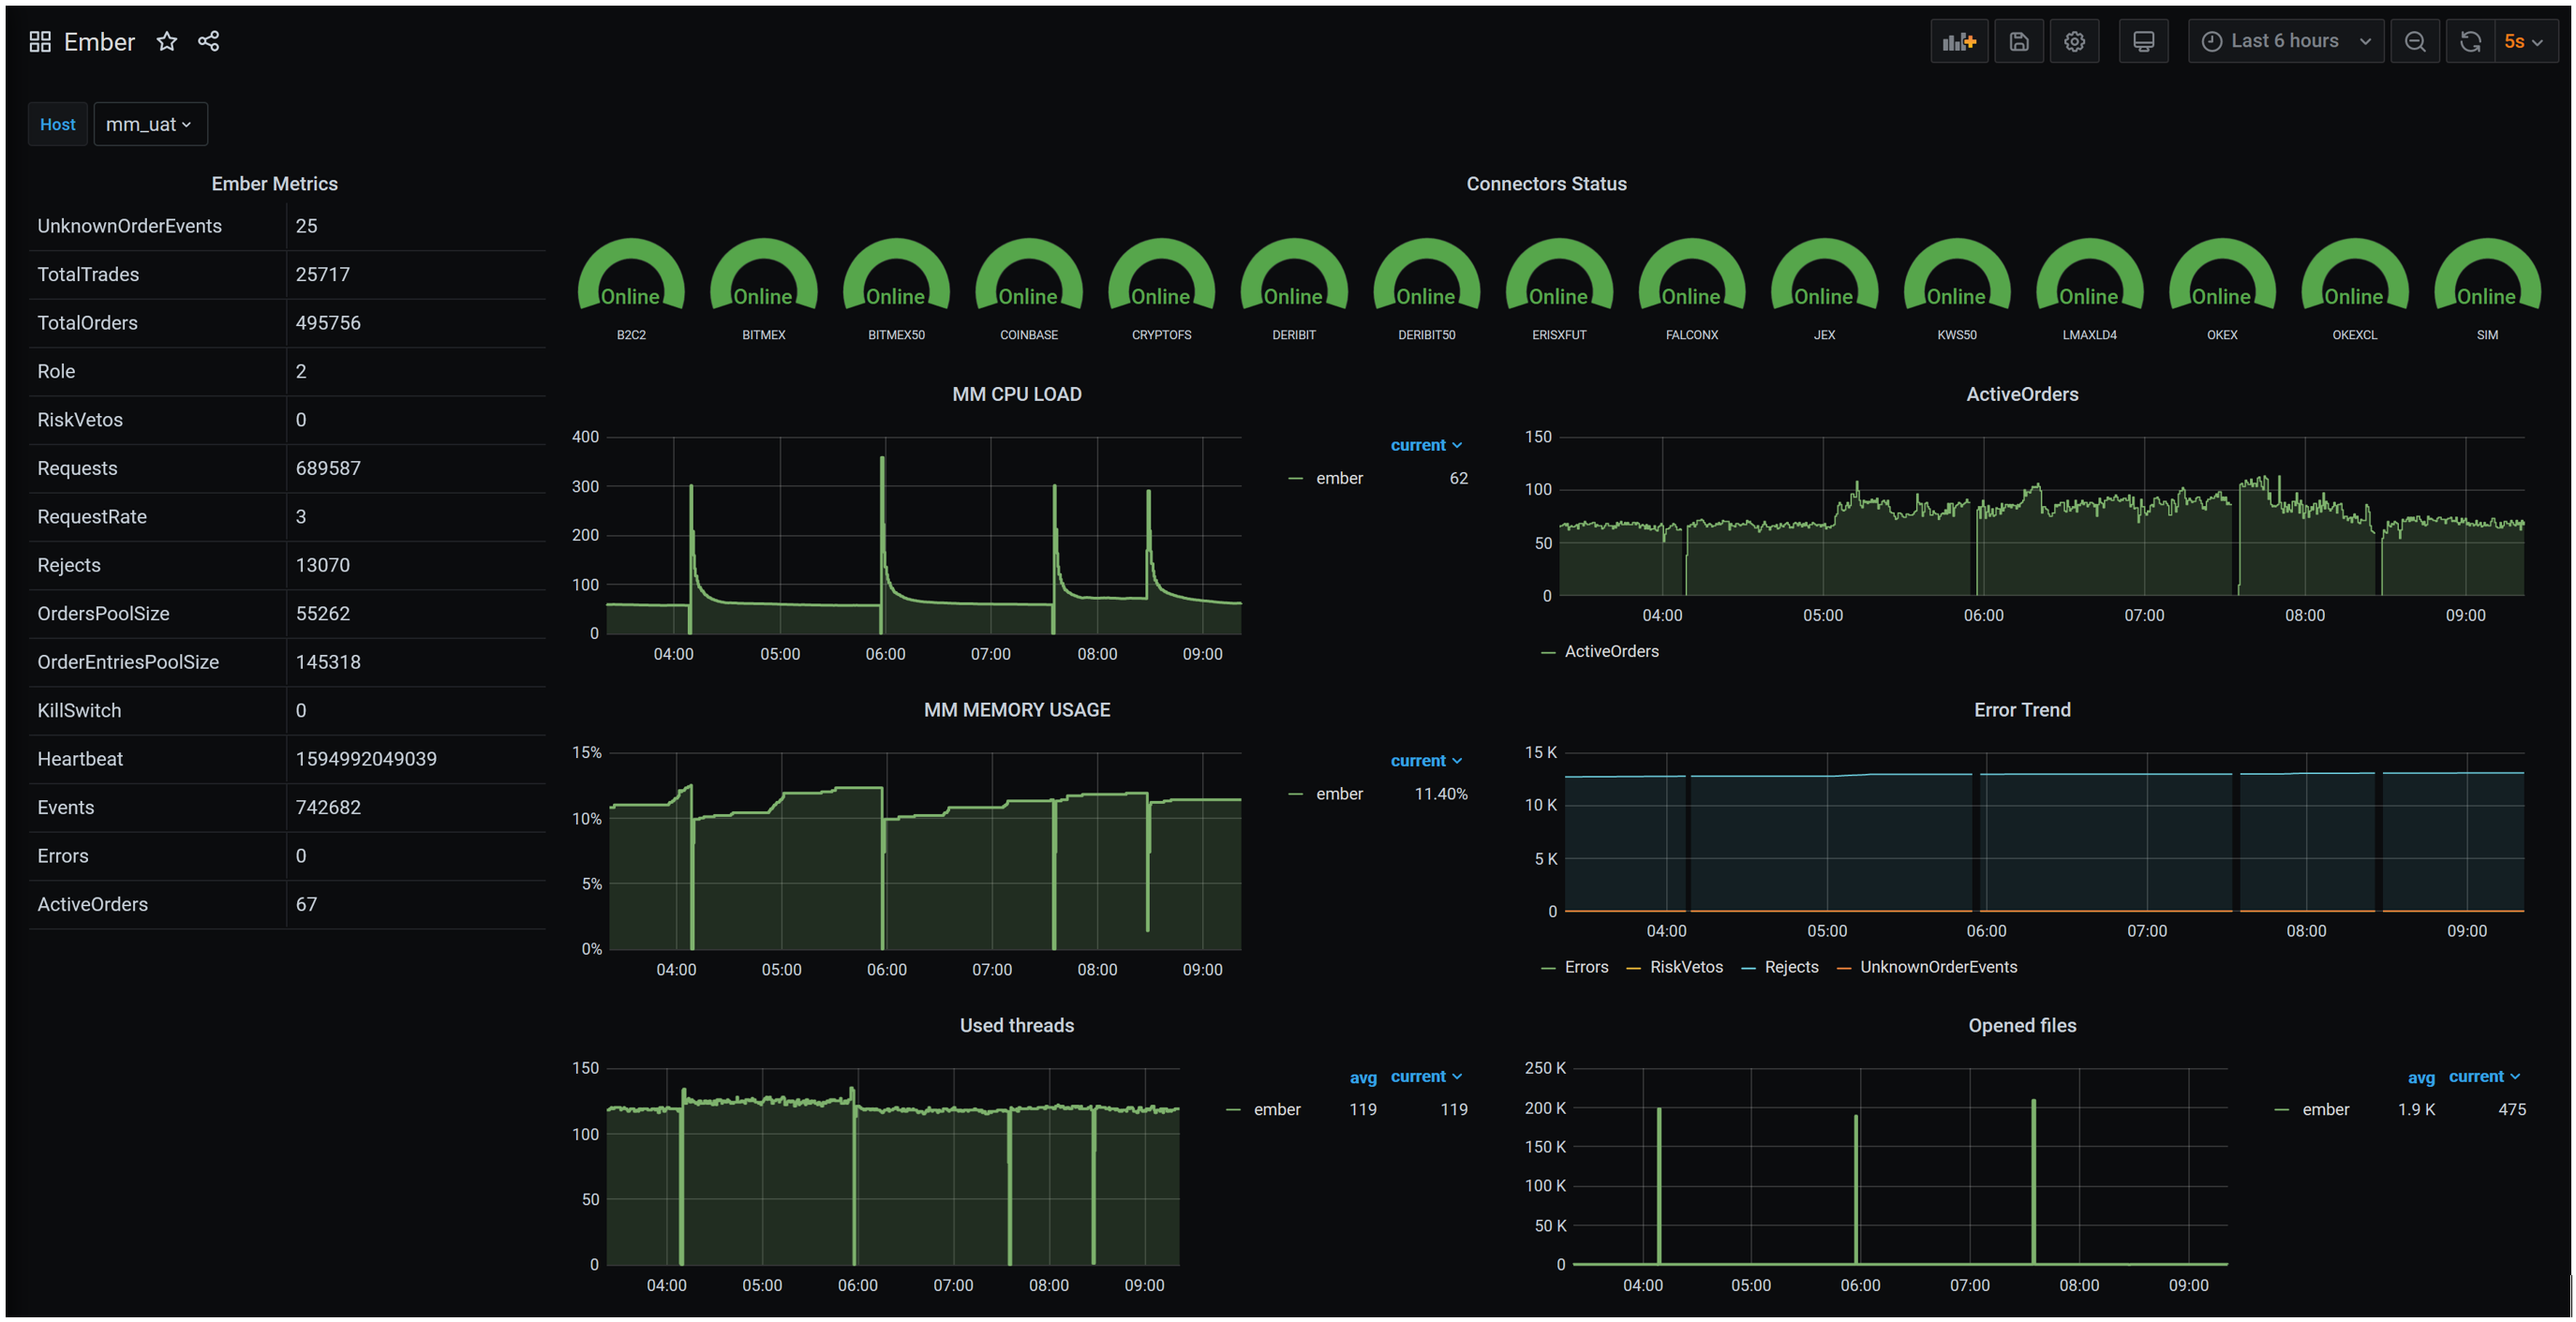
Once you enable Prometheus in ES Monitor and added Ember exporter stanza in Prometheus you need to restart both services. After that you can connect to simple Prometheus dashboard usually running on port 9090 to make sure configuration is correct:
Ember metrics are grouped into several categories:
- Ember process-wide metrics (active orders count, errors, trading status)
- Per-algorithm metrics (number of errors, custom metrics)
- Per-trading connector metrics (connection status, number of errors, etc.)
- Per-FIX Gateway session metrics (optionally per FIX Session metrics).
- etc.
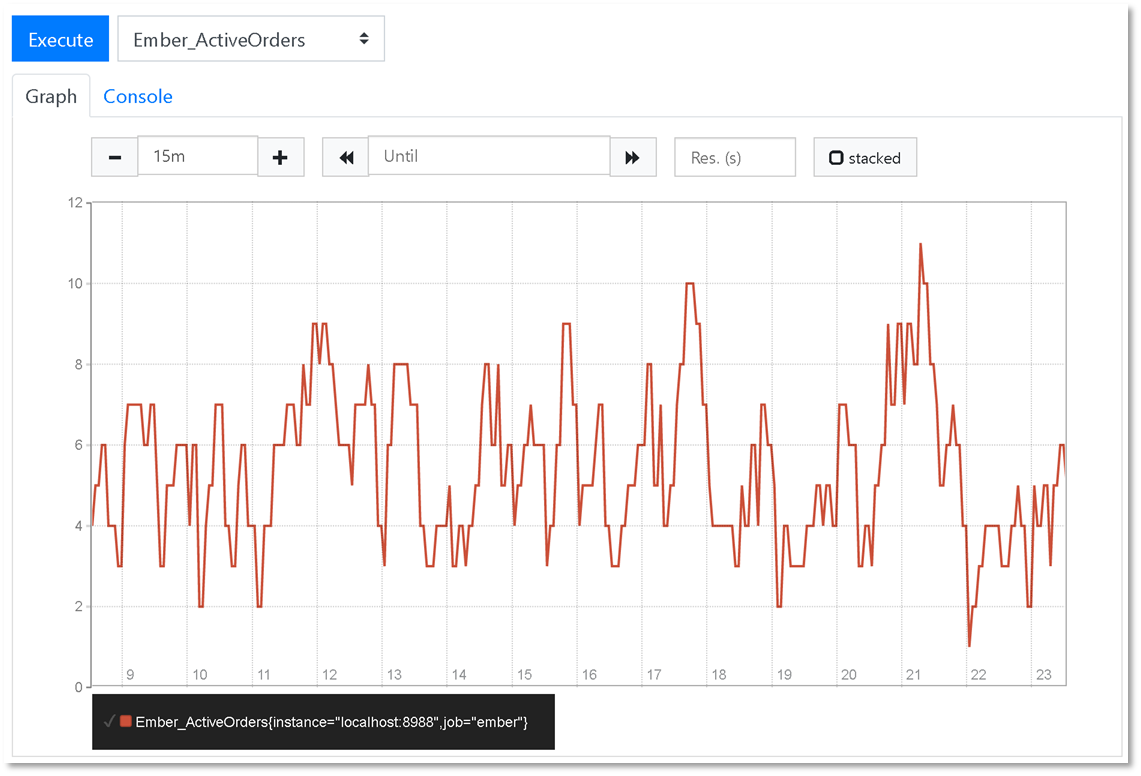
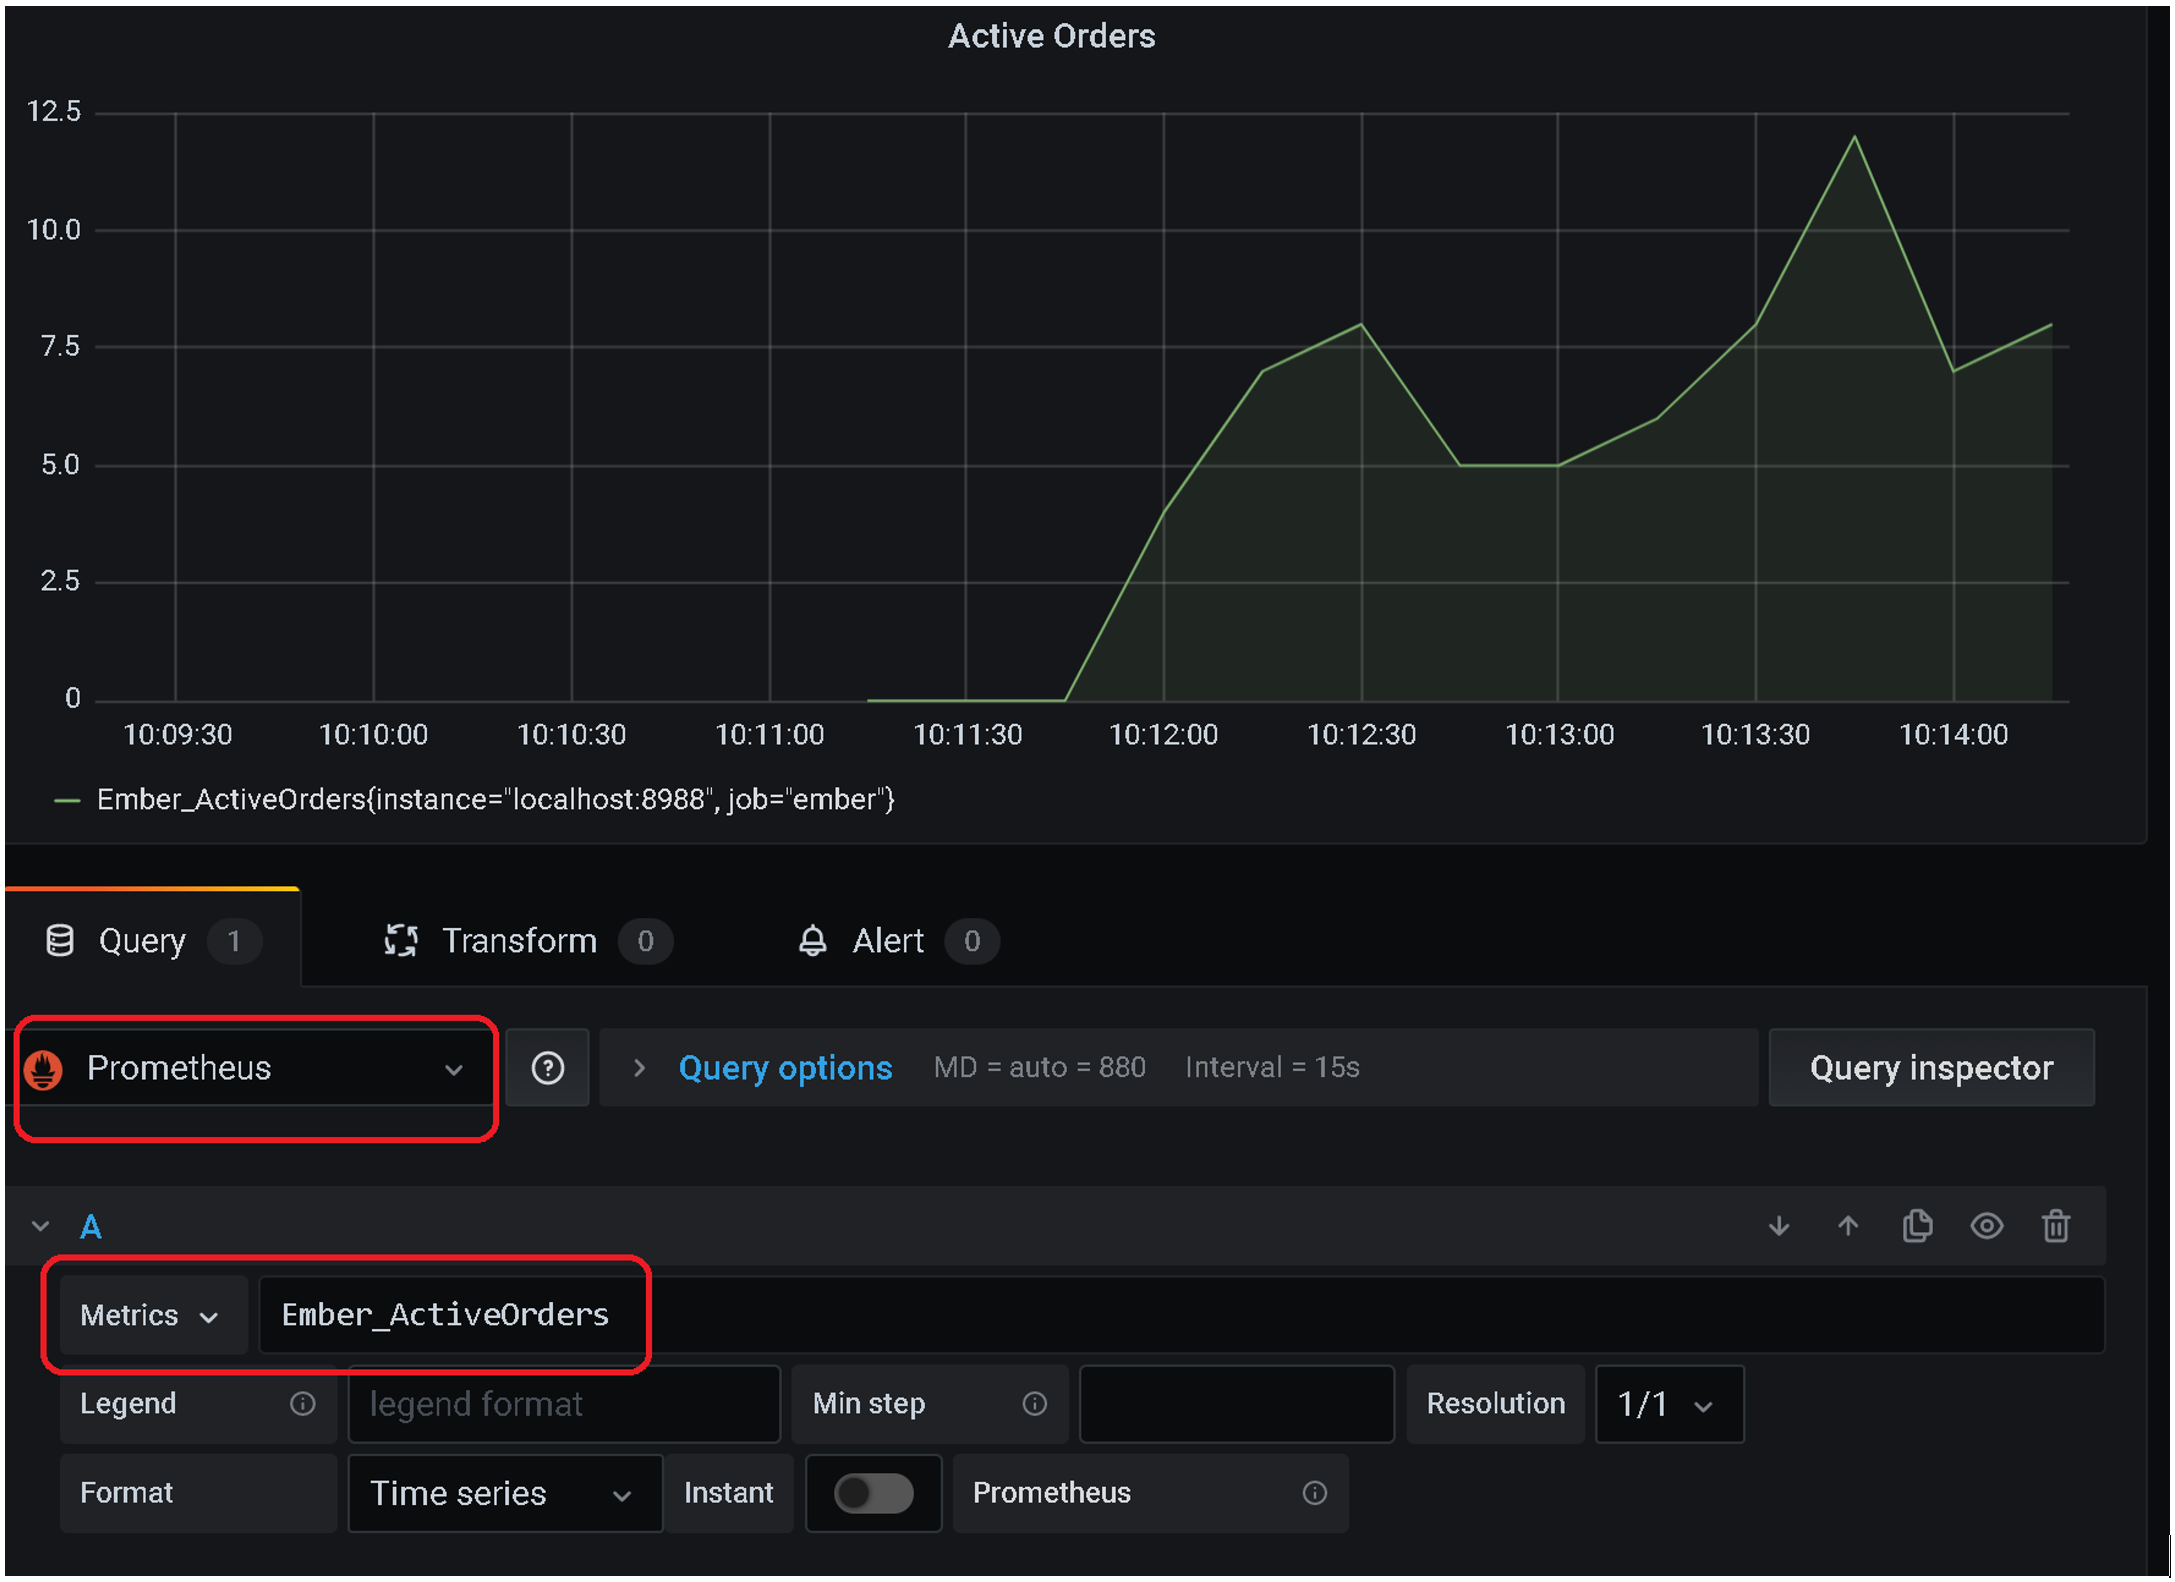
Here we chart active orders count (metric Ember_ActiveOrders):
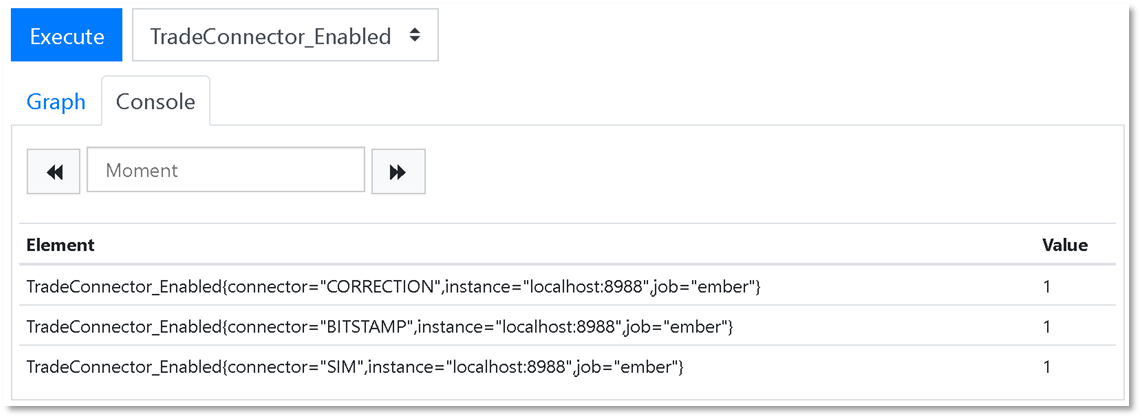
For components that usually run as multiple instances, we use Prometheus maps where component ID is used as a key. For example, on screenshot below we chart the status of trading connectors using TradeConnector_Enabled metric. Our specific ember process has three instances of trading connectors deployed (BITSTAMP, CORRECTION, and SIM). Status Each trading connector instance appears as separate value (1 = connected, 0 = disconnected):
Grafana
You can use popular charting tool Grafana to create Ember monitoring dashboard and setup alerts.
Grafana dashboards
Adding Prometheus-based metrics is simple. Just select Prometheus as Grafana panel data source and select Ember-related metric.
You may notice that Ember metrics are grouped into Ember, Algorithm, TradeConnector, TradingGateway, MarketDataGateway groups.
Alerts
Alerts in Grafana can be added for any dashboard. Use Alert tab in dashboard editor (third tab in the screenshot above).
Ember JMX Metrics Agent
As additional option you can export Ember counters via JMX. JMX is widely used protocol to monitor Java applications. This option requires running small service that reads counters and exposes them as JMX Metrics.
java -server -cp "/deltix/ember/lib/*" -Dember.work=/deltix/emberhome -Dember.home=/deltix/emberhome -Djava.rmi.server.hostname=10.0.0.46 -Dcom.sun.management.jmxremote=true -Dcom.sun.management.jmxremote.port=8053 -Dcom.sun.management.jmxremote.rmi.port=8053 -Dcom.sun.management.jmxremote -Dcom.sun.management.jmxremote.local.only=false -Dcom.sun.management.jmxremote.authenticate=false -Dcom.sun.management.jmxremote.ssl=false -Dzabbix.url="http://10.0.0.161:8077" -Dzabbix.user=Admin -Dzabbix.pass=zabbix deltix.ember.app.EmberStat2JmxAgent
Here we assume that this host has local IP address 10.0.0.46 and Zabbix server is running on 10.0.0.161.
Zabbix
This section describes how to monitor Ember JMX metrics via Zabbix. Connect to your Zabbix server:
Default port is 8077. Default username and password for Zabbix is Admin/zabbix
First, go to Configuration > Hosts and verify that Ember host is configured and JMX is available:
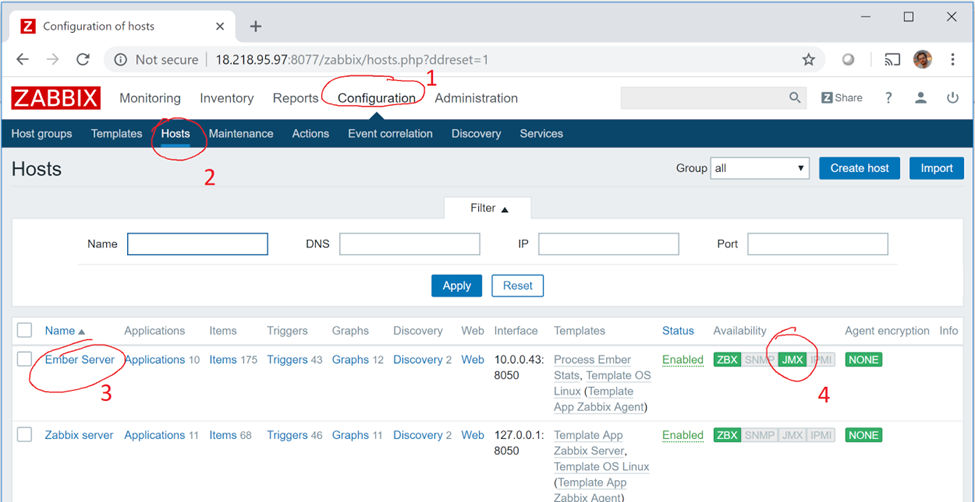
If not, verify that Ember JMX metrics agent is running.
Next, go to back to Monitoring > Dashboard and press ‘Edit Dashboard’ button in upper right corner.
Then click ‘Add Widget’ button to add Ember metrics to dashboard.
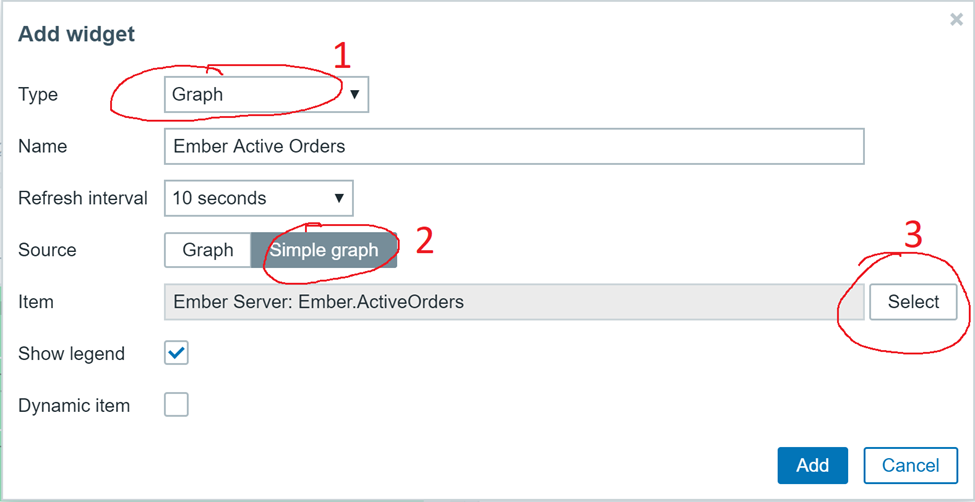
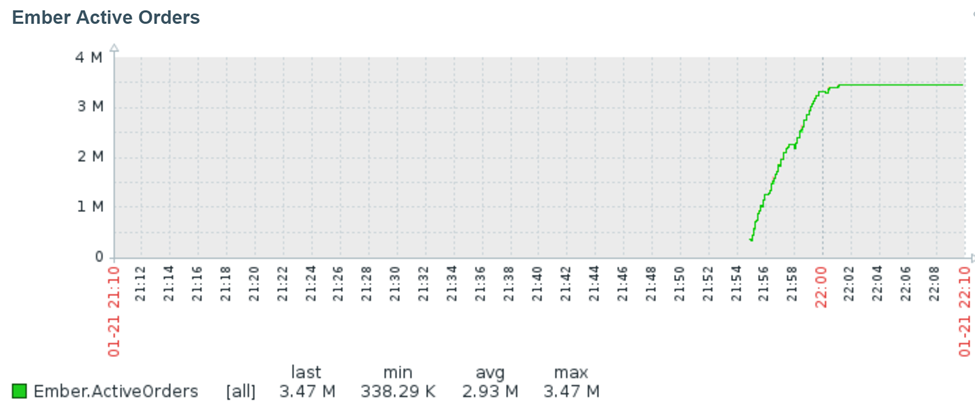
Make sure you use ‘Graph’ widget type that uses ‘Simple graph’ sources to see list of Ember metrics available for monitoring. Here we added Ember.ActiveOrders counter that displays number of active orders.
You can add multiple widgets displaying various metrics. Click ‘Save Changes’ in the upper right corner when done.
Your widgets should appear on dashboard and should look like this:
Zabbix charts have a bit outdated look and feel, use Grafana if you want more modern dashboard.
Displaying Zabbix metrics in Grafana
Adding Zabbix-provided metrics is very similar to Prometheus metrics (see chapter above).
- DataSource: Zabbix
- Group: QuantServer
- Server: Ember Server
- Item: metric that you want to display
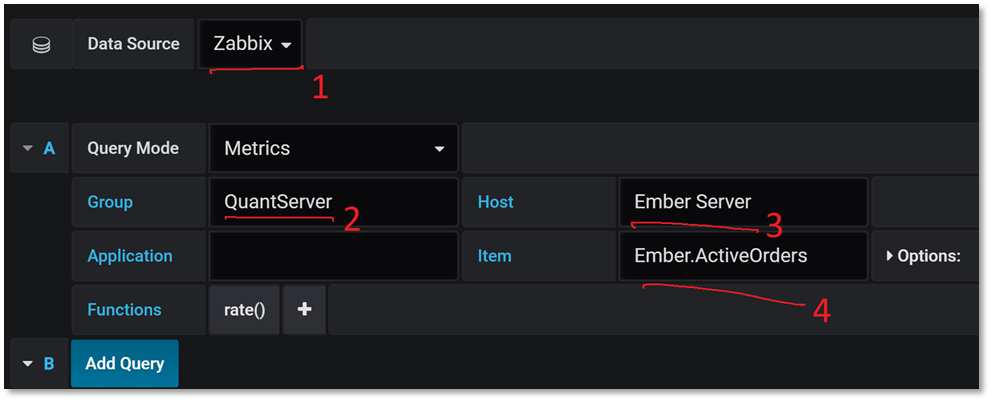
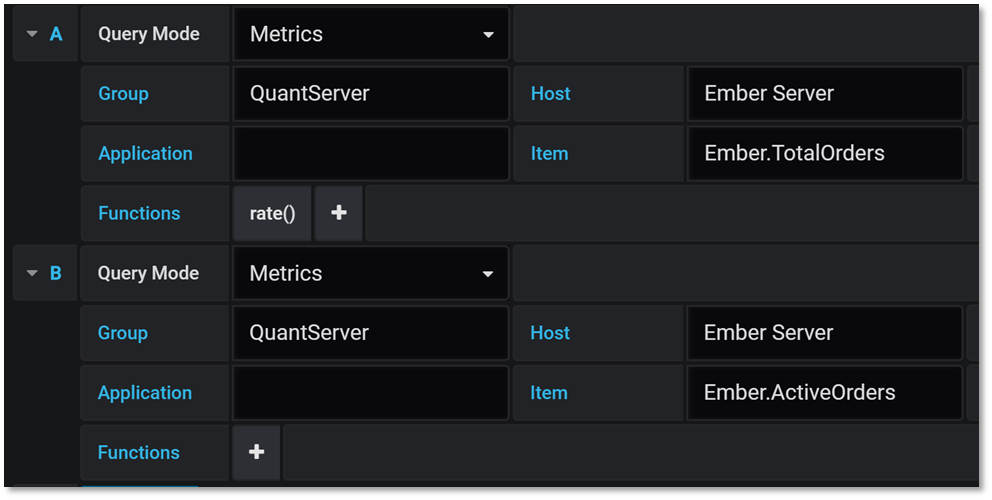
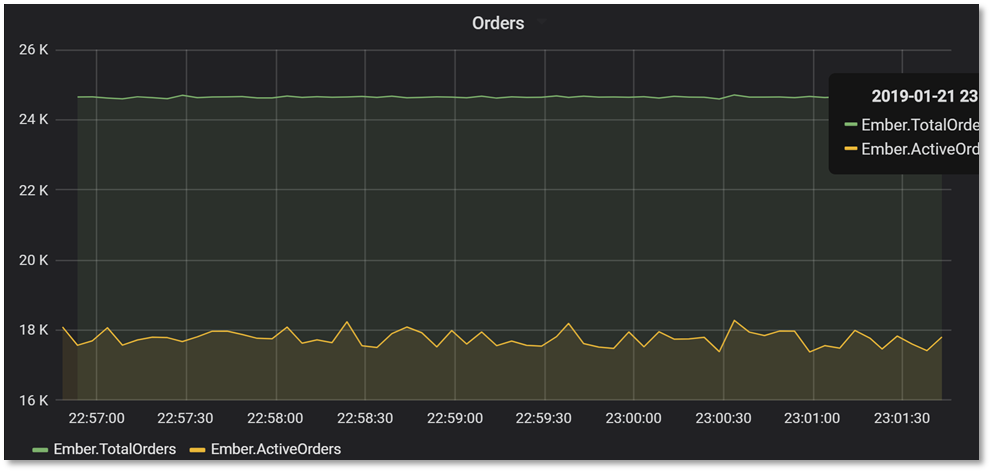
Here we also use function rate() to display change rate of selected metric. In Grafana you can select more than one metric per chart.
When done, click on Return to dashboard button in the upper right corner.
Appendix: List of Ember Metrics
Here is a list of standard Ember Metrics as of version 1.6.72 (July 2020):
Ember OMS Counters
| Metric | Description |
|---|---|
| Ember.TotalOrders | Total number of orders processed |
| Ember.TotalTrades | Total number of trades (fills) processed/ |
| Ember.ActiveOrders | Current number of active orders in OMS cache |
| Ember.Rejects | Total number of order rejects processed |
| Ember.Requests | Total number of trading requests (order submissions, replacements, cancellations) processed |
| Ember.RequestRate | Request Rate |
| Ember.Events | Total number of trading events (order acks/rejects, fills, replacement and cancel acks, etc.) processed |
| Ember.EventRate | Event rate |
| Ember.RiskVetos | Total number of risk limit violations |
| Ember.UnknownOrderEvents | Total number of unknown order events |
| Ember.Errors | Total number of internal exceptions in OMS related to message processing |
| Ember.OrdersPoolSize | To prevent frequent memory allocations OMS maintains object pool of order objects. After some time, inactive (completed) orders return to the pool. Persistent growth of this counter may be a sign of memory leak. |
| Ember.OrderEntriesPoolSize | To prevent frequent memory allocations OMS maintains object pool of order events objects. After some time, inactive (completed) orders return their events back to the pool. Persistent growth of this counter may be a sign of memory leak. |
| Ember.KillSwitch | 1 = Trading Halted, 0 = Trading Resumed (normal operation mode) |
| Ember.Role | Cluster Role of this node: 0 = Bootstrap (Start-up), 1 = Follower 2= Leader, 3 = Candidate |
| Ember.Heartbeat | Publishes Ember’s process clock (in Linux Epoch Time format) |
| Ember.RequestLat.* | Group of latency statistics (P0,P50,P99, etc.) that measure tick-to-order latency right after Ember OMS placed order request to Algorithm or Connector queue. |
| StartTime | Ember start time. Note that some of the "counter" kind of metrics are reset on each startup. This metric can be used to detect such reset. |
Algorithm Counters
The following table lists standard counters available for each algorithm. Note: algorithms very frequently define custom counters.
| Metric | Description |
|---|---|
| Algorithm.id.OutboundFailedOffers | Number of unsuccessful writes to OMS event queue. Non-zero value indicates OMS overload (message queue overflow) |
| Algorithm.id.OutboundSucceededOffers | Number of writes to OMS event queue |
| Algorithm.id.InboundFailedOffers | Number of unsuccessful writes to Algorithm’s request Queue. Non-zero value indicates algorithm overload (message queue overflow) |
| Algorithm.id.InboundSucceededOffers | Number of writes into Algorithm’s request queue |
| Algorithm.id.Enabled | 1=Enabled, 0=Disabled |
| Algorithm.id.MDLat.* | Group of latency statistics (P0,P50,P99, etc.) that measure latency up to the moment right after specific Algorithm is about to process market data message. |
| Algorithm.id.OELat.* | Group of latency statistics (P0,P50,P99, etc.) that measure tick-to-order latency right after specific Algorithm is dispatched order to Ember OMS. |
Where .id. in each metric name identifies algorithm. For example, counter Algorithm.NIAGARA.OutboundFailedOffers provides number of outbound failed offers for algorithm NIAGARA.
Trading Connector Counters
For each trading connector configured in the system (and identified by Id) you will see the following counters.
| Metric | Description |
|---|---|
| TradeConnector.id.OutboundFailedOffers | Number of unsuccessful writes to OMS event queue. Non-zero value indicates OMS overload (message queue overflow) |
| TradeConnector.id.OutboundSucceededOffers | Number of writes to OMS event queue |
| TradeConnector.id.Status | 0 = Disconnected, 1 = Connected |
| TradeConnector.id.InboundFailedOffers | Number of unsuccessful writes to Connector’s request Queue. Non-zero value indicates connector overload (message queue overflow) |
| TradeConnector.id.InboundSucceededOffers | Number of writes into Connector’s request queue |
| TradeConnector.id.Enabled | 1=Enabled, 0=Disabled |
| TradeConnector.id.PreLat.* | Group of latency statistics (P0,P50,P99, etc.) that measure latency up to the moment Ember is about to dispatch trading request to specific trade connector (at Trade Connector Proxy level). |
| TradeConnector.id.PostLat.* | Group of latency statistics (P0,P50,P99, etc.) that measure latency up to the moment right after Ember is dispatched trading request to specific trade connector (at Trade Connector Proxy level). |
| TradeConnector.id.RequestLat.* | Group of latency statistics (P0,P50,P99, etc.) that measure latency up to the moment right after specific Trade Connector is about to send trading request downstream (e.g. 35=D FIX message, or WebSocket message that places order). |
Where .id. in each metric name identifies trade connector. For example, counter TradeConnector.CME.OutboundFailedOffers provides number of outbound failed offers for connector CME.
FIX Gateway: MARKET DATA Gateway Counters
FIX Market Data Gateway counters are also described in FIX Gateway Administrator’s Guide (See overload control section). Each configured gateway is identified by Id.
| Metric | Description |
|---|---|
| MarketDataGateway.id.Transp.BytesReceived | Total Number of bytes received from all clients of this FIX Gateway (at Transport Layer) |
| MarketDataGateway.id.Transp.BytesSent | Total Number of bytes sent to clients of this FIX Gateway (at Transport Layer) |
| MarketDataGateway.id.Transp.MessagesReceived | Total Count of messages received from all clients of this FIX Gateway (at Transport Layer) |
| MarketDataGateway.id.Transp.MessagesSent | Total Count of messages sent to clients of this FIX Gateway (at Transport Layer) |
| MarketDataGateway.id.Transp.OutboundBackPressureDisconnects | Transport layer disconnects a client if it cannot write data into client socket (send buffer overflow). This counter reflects total number of such disconnects. |
| MarketDataGateway.id.Transp.InboundBackPressureDisconnects | Transport layer disconnects a client if it cannot enqueue inbound FIX message into Session Layer (usually due to overload). This counter reflects total number of such disconnects. |
| MarketDataGateway.id.Transp.ConnectionsAccepted | Total number of FIX client connections accepted from server start up. |
| MarketDataGateway.id.Transp.ConnectionsRejected | Total number of FIX client connections rejects from server start up. Client connection can be rejected due to invalid password, incorrect source IP, or session comp ID mismatch, etc. For example, attempts to connect on gateway port that already has active FIX session also results in a reject and included in this counter. |
| MarketDataGateway.id.Transp.ConnectionsActive | Current count of active FIX clients (sessions) |
| MarketDataGateway.id.Transp.DelayedDisconnectsTotal | |
| MarketDataGateway.id.Transp.InboundThrottle | Incremented when Transport Layer throttles inbound FIX messages to reduce system load. Throttling logic is activated when inbound queue that connects Transport Layer with Session layer has less than inboundThrottleLimit bytes. |
| MarketDataGateway.id.Transp.IdleCycles | Total number of times when Transport Layer finished execution cycle with zero work done (i.e. idling). |
| MarketDataGateway.id.Transp.ActiveCycles | Total number of times when Transport Layer finished execution cycle with some work done (e.g. some messages pulled from TimeBase, some messages sent to FIX client, etc.) |
| MarketDataGateway.id.Transp.ActiveTime | Total time spent on work on Transport Layer. This counter must be enabled explicitly by the gateway configuration option "measureActiveTime = true". Turned off by default because it calls System.nanoTime() each time when we switch between active and idle states. It is not recommended turning this counter on if you use more than one MDG in same Ember instance. |
| MarketDataGateway.id.Sess.SendQueueBackPressure | |
| MarketDataGateway.id.Transp.SendQueueSize | Maximum observed size of outbound queue over 1 second interval on the side on consumer (Transport Layer). |
| MarketDataGateway.id.Server.MDPublishFailure | Incremented each time when Session Layer cannot publish Market Data Update to Session Layer (usually due to overload from outbound back pressure). |
| MarketDataGateway.id.Server.TradePublishFailure | Incremented each time when Session Layer cannot publish Market Trade message to Session Layer (usually due to overload from outbound back pressure). |
| MarketDataGateway.id.Server.OtherMessagePublishFailure | Incremented each time when Session Layer cannot publish non-market data message to Session Layer (usually due to overload from outbound back pressure). |
| MarketDataGateway.id.Server.MDPublishDelayBackPressure | This metric report number of times MDG delayed sending market data to clients due to back pressure (outbound message queue is at least half full). If you observe growth of this metric, then Market Data gateway is unable to send data as fast as it configured (See “minimumUpdateInterval” setting). |
| MarketDataGateway.id.Server.AppMessagesProcessed | Total number of application-level FIX messages processed by Session Layer. |
| MarketDataGateway.id.Server.FixMessagesProcessed | Total number of all FIX messages processed by Session Layer. |
| MarketDataGateway.id.Server.MarketDataUpdatesProcessed | Total number of Market Data feed messages (typically from TimeBase) processed by FIX Market Data Session Layer. |
| MarketDataGateway.id.Server.Errors | |
| MarketDataGateway.id.Server.StalePollerReset | |
| MarketDataGateway.id.Server.MarketMessageInfoReceived | |
| MarketDataGateway.id.ProxyFailedOffers |
Where .id. in each metric name identifies market data gateway.
FIX Gateway: Trade Gateway Counters
| Metric | Description |
|---|---|
| TradeGateway.id.Transp.BytesReceived | Total Number of bytes received from all clients of this FIX Gateway (at Transport Layer) |
| TradeGateway.id.Transp.BytesSent | Total Number of bytes sent to clients of this FIX Gateway (at Transport Layer) |
| TradeGateway.id.Transp.MessagesReceived | Total Count of messages received from all clients of this FIX Gateway (at Transport Layer) |
| TradeGateway.id.Transp.MessagesSent | Total Count of messages sent to clients of this FIX Gateway (at Transport Layer) |
| TradeGateway.id.Transp.OutboundBackPressureDisconnects | Transport layer disconnects a client if it cannot write data into client socket (send buffer overflow). This counter reflects total number of such disconnects. |
| TradeGateway.id.Transp.InboundBackPressureDisconnects | Transport layer disconnects a client if it cannot enqueue inbound FIX message into Session Layer (usually due to overload). This counter reflects total number of such disconnects. |
| TradeGateway.id.Transp.ConnectionsAccepted | Total number of FIX client connections accepted from server start up. |
| TradeGateway.id.Transp.ConnectionsRejected | Total number of FIX client connections rejects from server start up. Client connection can be rejected due to invalid password, incorrect source IP, or session comp ID mismatch, etc. For example, attempts to connect on gateway port that already has active FIX session also results in a reject and included in this counter. |
| TradeGateway.id.Transp.ConnectionsActive | Current count of active FIX clients (sessions) |
| TradeGateway.id.Transp.DelayedDisconnectsTotal | |
| TradeGateway.id.Transp.InboundThrottle | Incremented when Transport Layer throttles inbound FIX messages to reduce system load. Throttling logic is activated when inbound queue that connects Transport Layer with Session layer has less than inboundThrottleLimit bytes. |
| TradeGateway.id.Transp.IdleCycles | Total number of times when Transport Layer finished execution cycle with zero work done (i.e. idling). |
| TradeGateway.id.Transp.ActiveCycles | Total number of times when Transport Layer finished execution cycle with some work done (e.g. some messages pulled from TimeBase, some messages sent to FIX client, etc.) |
| TradeGateway.id.Sess.SendQueueBackPressure | |
| TradeGateway.id.Transp.SendQueueSize | Maximum observed size of outbound queue over 1 second interval on the side on consumer (Transport Layer). |
| TradeGateway.id.OutboundFailedOffers | |
| TradeGateway.id.OutboundSucceededOffers | |
| TradeGateway.id.InboundFailedOffers | |
| TradeGateway.id.InboundSucceededOffers |
Where .id. in each metric name identifies order entry gateway.
Appendix A: Examples
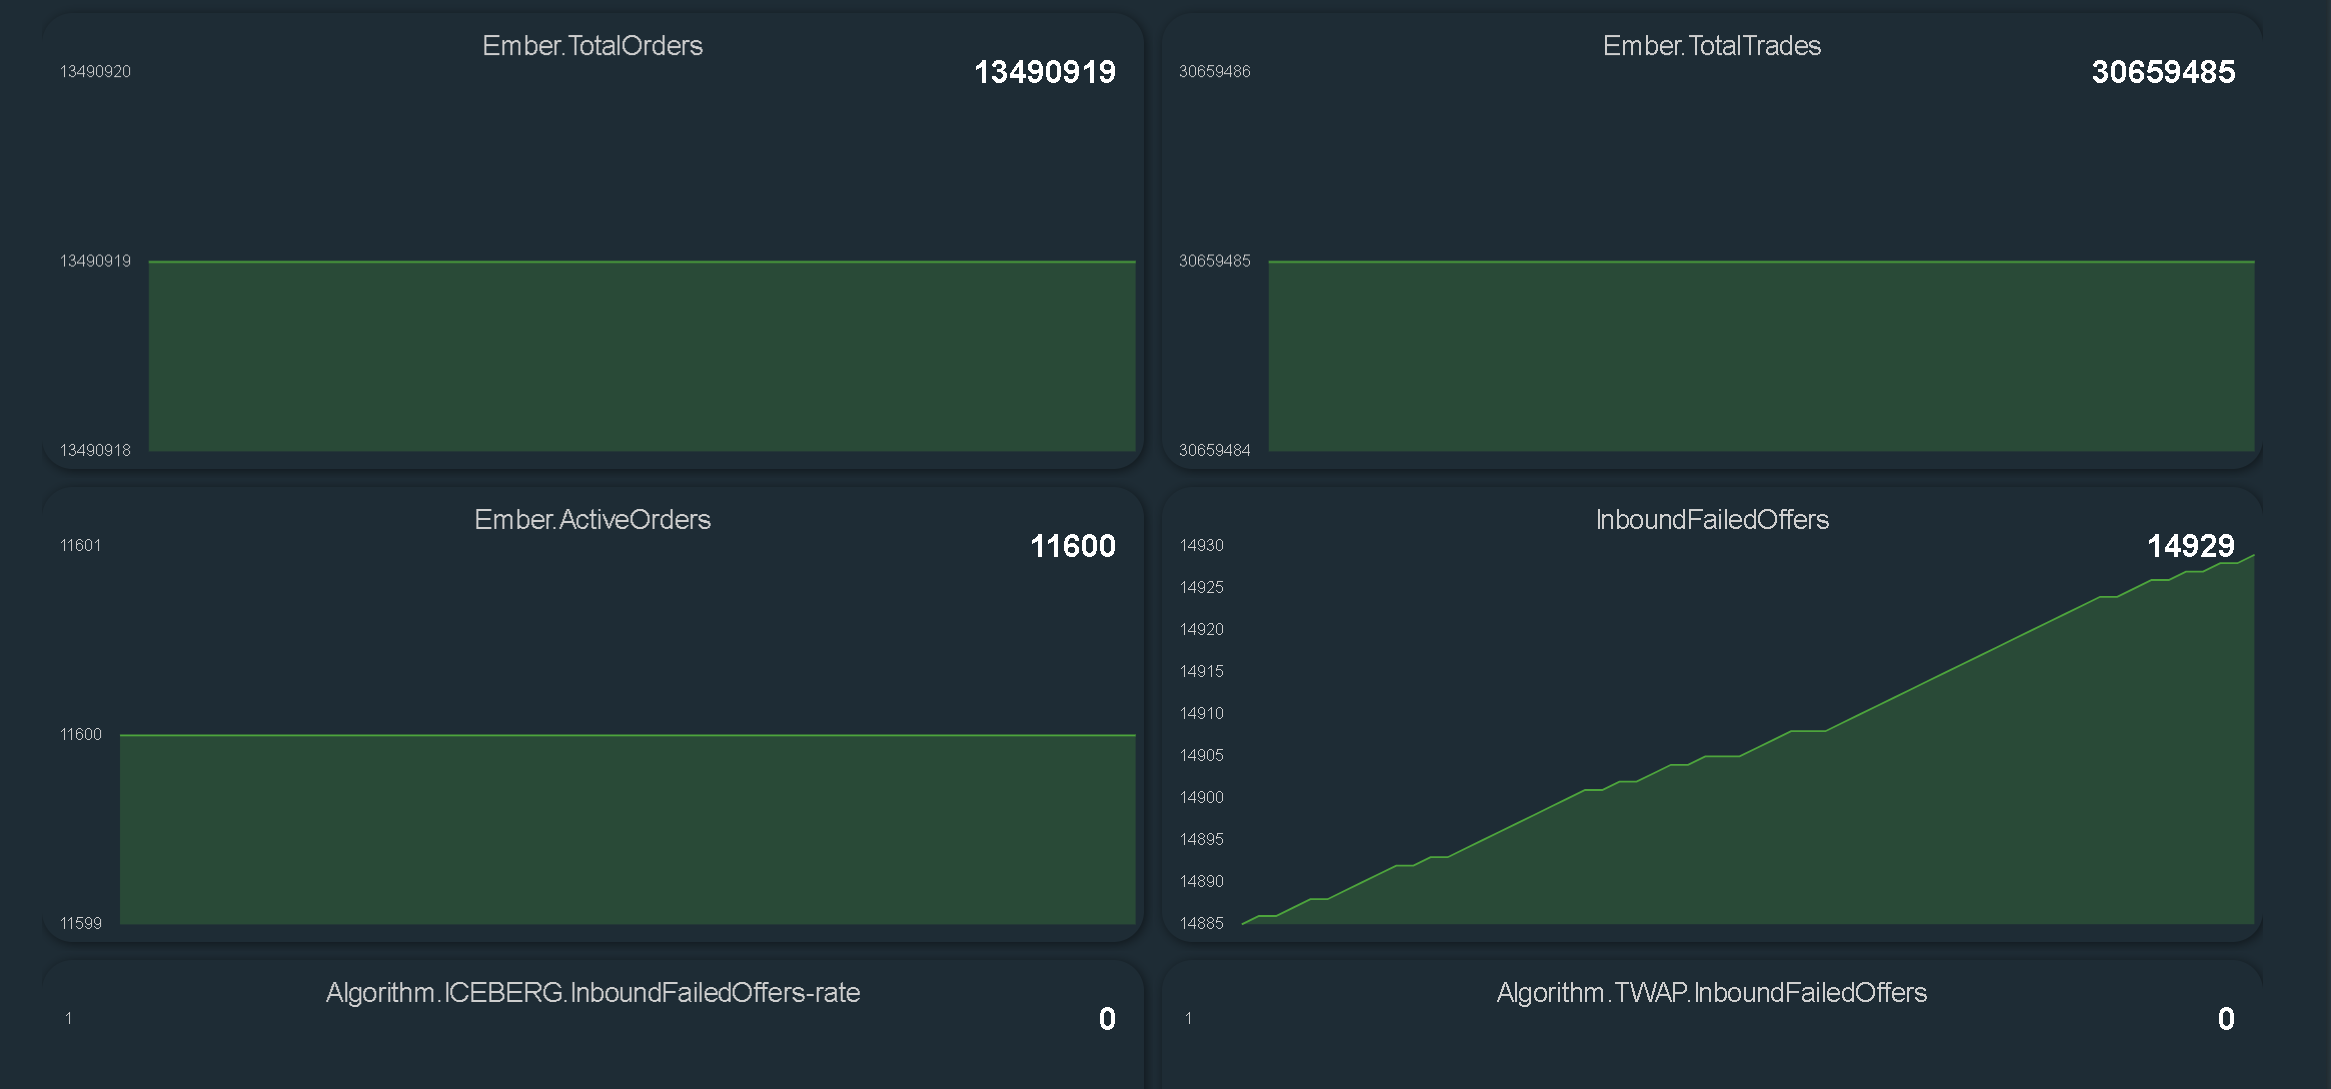
Here is an example of problematic Ember state.
You can see that system is not incrementing total number of orders/trades counter and at the same time InboundFailedOffers keeps raising (messages cannot be written into Ember Journal).
In this particular case system run out of disk space on $EMBER_WORK volume. As result, no new messages can be written into ember journal and hence OMS stopped processing new orders.
Appendix B: Prometheus-compatible JVM memory metrics
Ember supports mini-web-server that exposes key JVM memory statistics information via Prometheus-compatible endpoint.
You can add the following stanza to ember.conf:
network.prometheus {
  host = localhost
  port = 8077
}
Once you enable this you can access this endpoint via HTTP at http://localhost:8077/metrics. Sample output:
Sample output:
# HELP jvm_memory_used_bytes Used JVM memory (in bytes)
# TYPE jvm_memory_used_bytes gauge
jvm_memory_used_bytes{area="heap"} 1380543704
jvm_memory_used_bytes{area="offheap"} 82029576
# HELP jvm_memory_committed_bytes Amount of memory in bytes that is committed for the Java virtual machine to use (in bytes)
# TYPE jvm_memory_committed_bytes gauge
jvm_memory_committed_bytes{area="heap"} 8303607808
jvm_memory_committed_bytes{area="offheap"} 82575360
# HELP jvm_gc_pause_milliseconds_sum The total cumulative time spent in garbage collection pauses (in millis)
# TYPE jvm_gc_pause_milliseconds_sum counter
jvm_gc_pause_milliseconds_sum 204
Here is garbage-collectable allocatoins of 60000 queries of this endpoint:
       bytes  percent  samples  top
  ----------  -------  -------  ---
     3145722   12.24%        6  java.lang.management.MemoryUsage
     2621435   10.20%        5  java.net.InetAddress$InetAddressHolder
     2621435   10.20%        5  java.util.concurrent.locks.ReentrantLock$NonfairSync
     2621435   10.20%        5  jdk.internal.ref.CleanerImpl$PhantomCleanableRef
     2621435   10.20%        5  sun.nio.ch.NioSocketImpl
     1572861    6.12%        3  java.net.InetSocketAddress
     1572861    6.12%        3  java.net.Socket$SocketInputStream
     1572861    6.12%        3  java.net.Socket$SocketOutputStream
     1572861    6.12%        3  java.util.concurrent.locks.ReentrantLock
     1048574    4.08%        2  java.io.FileDescriptor
     1048574    4.08%        2  java.net.Inet4Address
     1048574    4.08%        2  java.net.Socket
     1048574    4.08%        2  sun.nio.ch.SocketOptionRegistry$RegistryKey
      524287    2.04%        1  java.net.InetSocketAddress$InetSocketAddressHolder
      524287    2.04%        1  sun.nio.ch.NioSocketImpl$1
      524287    2.04%        1  sun.nio.ch.NioSocketImpl$2