Optimizing Journal load time
TL;DR
The two most common causes of a growing journal directory (which leads to slow load):
- Journal compactor is not running — without it, old data partitions are never cleaned up and the journal grows unbounded.
- Journal compactor is running but stalled — if any journal archiver (e.g. Data Warehouse, Drop Copy service) is paused or lagging, the compactor cannot delete unarchived partitions and falls behind. Check archiver health if the compactor appears to be running but the journal directory keeps growing.
Overview
Ember design is based on event sourcing ideas. This means that OMS state is preserved using transaction log (journal) which is reloaded on each Ember startup. This document describes what is involved in loading ember journal and how to optimize it.
Normal Journal
Client journal contains a mix of internal matching and smart order routing orders. Journal directory is about 6Gb:
10/10/2022  09:45 AM     1,073,741,824 data7796
10/10/2022  10:10 AM     1,073,741,824 data7797
10/10/2022  10:35 AM     1,073,741,824 data7798
10/10/2022  10:56 AM     1,073,741,824 data7799
10/10/2022  12:40 PM        75,497,472 data7800
10/10/2022  10:56 AM             1,024 fence-warehouse-clickhouse
10/10/2022  10:56 AM             1,024 fence-warehouse-marketmaker
10/10/2022  10:56 AM             1,024 fence-warehouse-s3
10/10/2022  10:56 AM             1,792 meta
10/10/2022  09:20 AM       453,733,216 snapshot7795
10/10/2022  09:47 AM       454,225,744 snapshot7796
10/10/2022  10:12 AM       453,683,984 snapshot7797
10/10/2022  10:36 AM       453,333,312 snapshot7798
              13 File(s)  6,185,445,888 bytes
Observed start times:
2022-10-10 15:09:43.540584800 INFO [trade-engine] EMBER has loaded snapshot. Snapshot: snapshot7798 (432.3 MB) at 2022-10-10T14:35:17.813Z. Duration: 1 minute 7 seconds. Rate: 6.4 MB/s.
2022-10-10 15:09:43.540643500 INFO [trade-engine] EMBER is loading partitions. Partitions: 7799-7800.
2022-10-10 15:10:17.554719900 INFO [trade-engine] EMBER has loaded partitions. Partitions: 7799-7800. Duration: 34 seconds. Rate: 30.6 MB/s.
Journal reload took about 100 seconds.
Journal without recent snapshots
Client operates matching engine. Journal takes 5.5Gb and has the following state:
10/05/2022  08:10 PM     1,073,741,824 data5
10/05/2022  08:10 PM     1,073,741,824 data6
10/05/2022  08:10 PM     1,073,741,824 data7
10/05/2022  08:10 PM     1,073,741,824 data8
10/05/2022  08:10 PM     1,073,741,824 data9
10/05/2022  08:10 PM        58,720,256 data10
10/05/2022  08:10 PM             1,792 meta
10/05/2022  08:10 PM         7,280,128 snapshot4
               8 File(s)  5,434,711,296 bytes
This journal records matching engine operation with the following statistics:
            MutableOrderNewEvent - 5467876
          MutableOrderNewRequest - 5467876
         MutableOrderCancelEvent - 5073670
    MutableOrderTradeReportEvent - 765809
      MutableOrderReplaceRequest - 4857
        MutableOrderReplaceEvent - 4857
       MutableOrderStatusRequest - 698
         MutablePositionSnapshot - 26
       MutableOrderCancelRequest - 22
         MutableShutdownResponse - 10
          MutableKillSwitchEvent - 4
   MutableOrderCancelRejectEvent - 4
        MutableKillSwitchRequest - 4
          MutableNodeStatusEvent - 2
        MutableRiskUpdateRequest - 1
            MutableSequenceReset - 1
Loading this journal would require ember to read entire 5.5Gb of data (snapshot followed by each partition).
2022-10-05 21:29:29.377356400 INFO [trade-engine] EMBER has loaded partitions.
Partitions: 5-9. Duration: 36 minutes 26 seconds. Rate: 2.3 MB/s.
One thing we notice is that snapshot is far behind the most recent partition. If we force ember-journal-compact service to catch up and produce us most recent snapshot. Adding snapshot:
10/05/2022 10:18 PM 41,934,608 snapshot8
Journal loading time decreased significantly:
2022-10-06 15:36:05.617468400 INFO [trade-engine] EMBER has loaded partitions. Partitions: 9-9. Duration: 4 minutes 22 seconds. Rate: 3.9 MB/s.
Inspect Journal Compactor Logs
Logs of journal compactor is the first thing to check. For example if journal compactor service experiences out-of-memory situation, it will log severe error and auto-restart. As result, it may appear to be running at any random point in time, but it may be locked in a load data partition -> crash -> restart loop. As result, new journal snapshots will not be generated and journal data will keep accumulating. If this situation neglected this may lead to disk overflow.
Profiling journal load
Bulk of time is spent replaying historical trades, and order requests. The following Profiler screenshot shows relative processing cost observed while loading this specific client journal.
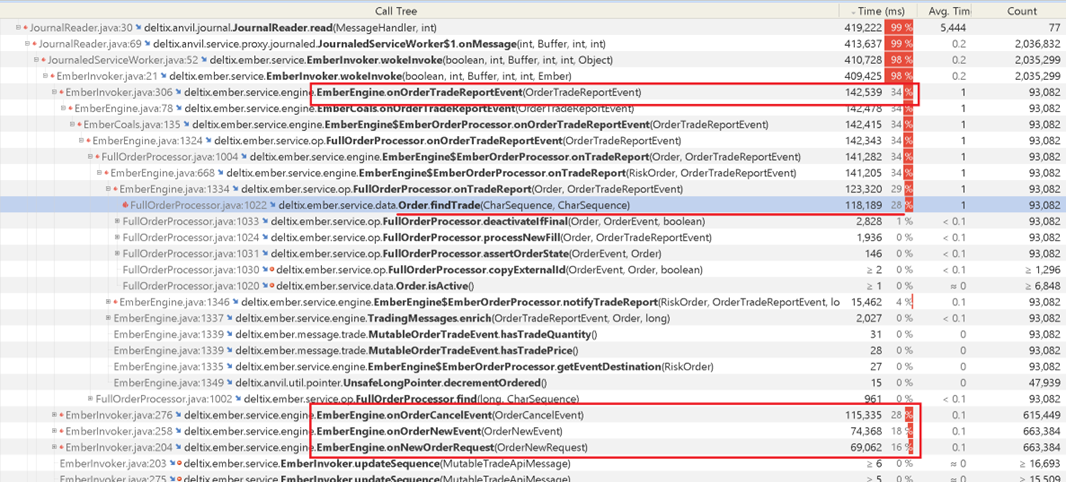
Further investigation found that client journal had many orders that collected half a million trades per order. Based on our experience this is highly unusual.
Final recommendations
Steps to improve journal loading time:
- Make sure journal compacter is doing its work. Normally Ember should only read one snapshot and one data partition on startup.
- Verify that journal snapshot is relatively small. Snapshot should only keep all active order and certain amount of recent inactive orders. Normal snapshot size is less than 100Mb.
- Make sure trading patterns do not produce numerous exceptional situations that result in extra logging. Examples:
- Orders for no longer existing instruments,
- Duplicate orders
- Clearly invalid order requests
- Unrealistically high number of trades per order. Such orders usually are artifacts of some internal testing (e.g. with millions trades per order).
- Reduce amount of Position Projections that Ember is tracking
- Disable deep trade duplicate check (e.g. using ``-Dember.oms.max.trade.dedup.depth=32`)
- Disable assertions (if you running JVM with
-ea) - Consider configuring smaller size of data partitions