Profiling Ember
This article explains how to profile Ember using popular Async Profiler
Profiling under systemd
- Download and unzip the latest version of
async-profiler# download
wget https://github.com/jvm-profiling-tools/async-profiler/releases/download/v2.5/async-profiler-2.5-linux-x64.tar.gz
# unzip
tar -xvzf async-profiler-2.5-linux-x64.tar.gz - Set runtime variables for capturing kernel stack
sudo sysctl kernel.perf_event_paranoid=1
sudo sysctl kernel.kptr_restrict=0 - Find
EmberAppprocess id viajpscommand - Run profiler and capture flame graph
cd async-profiler-2.5-linux-x64
./profiler.sh -d 300 -f ~/ember-$(date +'%Y%m%d-%H%M').html <EMBER-PID>
Profiling under docker
- Start ember container with
privileged: trueparameter (editdocker-compose.ymlfile and restart). NOTE: unsafe, so don't forget to remove itember:
privileged: truenoteIf you are on Ember 1.14+ where Deltix services are running under non-root user, see Appendix below.
- Exec into ember container
docker compose exec ember sh - Download and unzip the latest version of
async-profiler# download
wget https://github.com/jvm-profiling-tools/async-profiler/releases/download/v2.9/async-profiler-2.9-linux-musl-x64.tar.gz
# unzip
tar -xvzf async-profiler-2.9-linux-musl-x64.tar.gz - Set runtime variables for capturing kernel stack
sysctl kernel.perf_event_paranoid=1
sysctl kernel.kptr_restrict=0 - Run profiler and capture flame graph
cd async-profiler-2.9-linux-musl-x64
./profiler.sh -d 300 -f /var/lib/emberhome/ember-$(date +'%Y%m%d-%H%M').html 1 - If you get the error below:Run the following and try again:
Failed to inject profiler into 1
Error loading shared library libstdc++.so.6: No such file or directory (needed by /root/async-profiler-2.9-linux-musl-x64/build/libasyncProfiler.so)apk add libstdc++ - Find the result on host in
ember-home/directory
Profiling Example
In this example we are going to profile single algorithm that implements NIAGARA matching engine. As with any algorithm, each deployed algorithm instance runs in a single thread. Mission-critical algorithms should be pinned to isolated CPU core.
First we set up randomized load. Ember has a number of simple bots that simulate given number of FIX client clients submitting realistic flow of orders at given rate.
After repeating Profiler setup and system configuration steps defined above, let's run the profiler.
We are going to be filtering for stack frames that have Niagara code:
./profiler.sh -e cpu -d 300 -I '*Niagara*' -f ../ember-$(date +'%Y%m%d-%H%M').html --title "CPU profile" 1
Sample output:
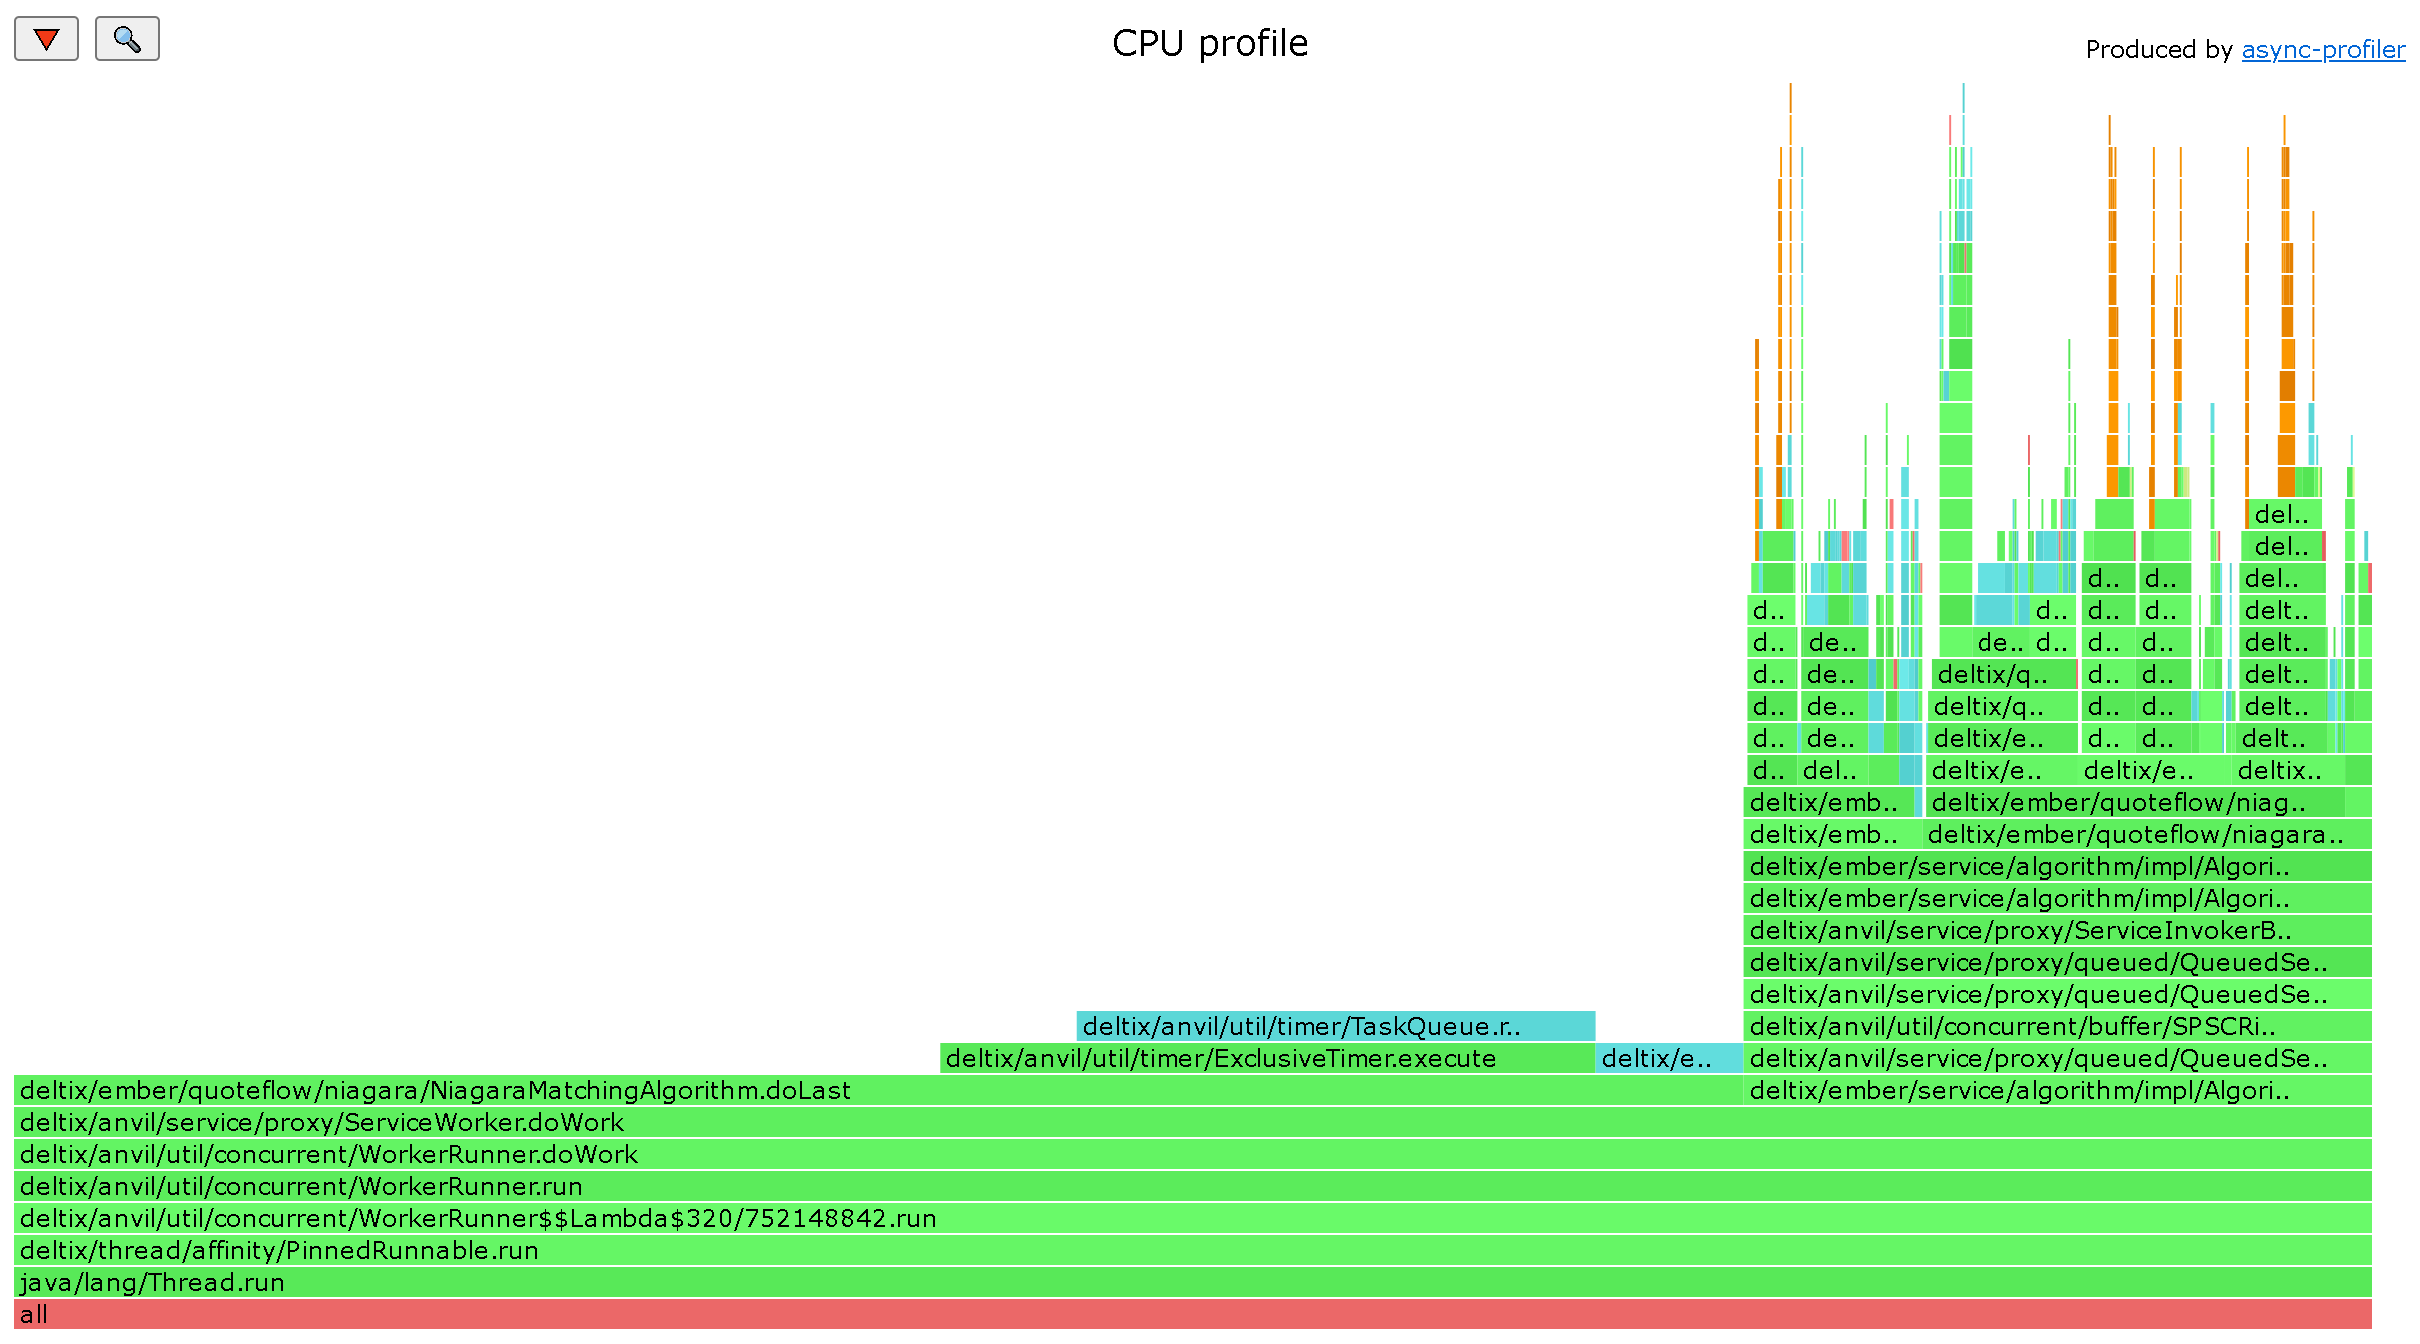 What we can see from this report (unfortunately we can't paste dynamic HTML here):
- Matching engine is idle 3/4 of the time (CPU spin is caught in
doLast()that checks if we have any timers ready, and there are none). - About 1/4 of time is spent on processing inbound order requests. If we zoom in we can drill down on request processing:
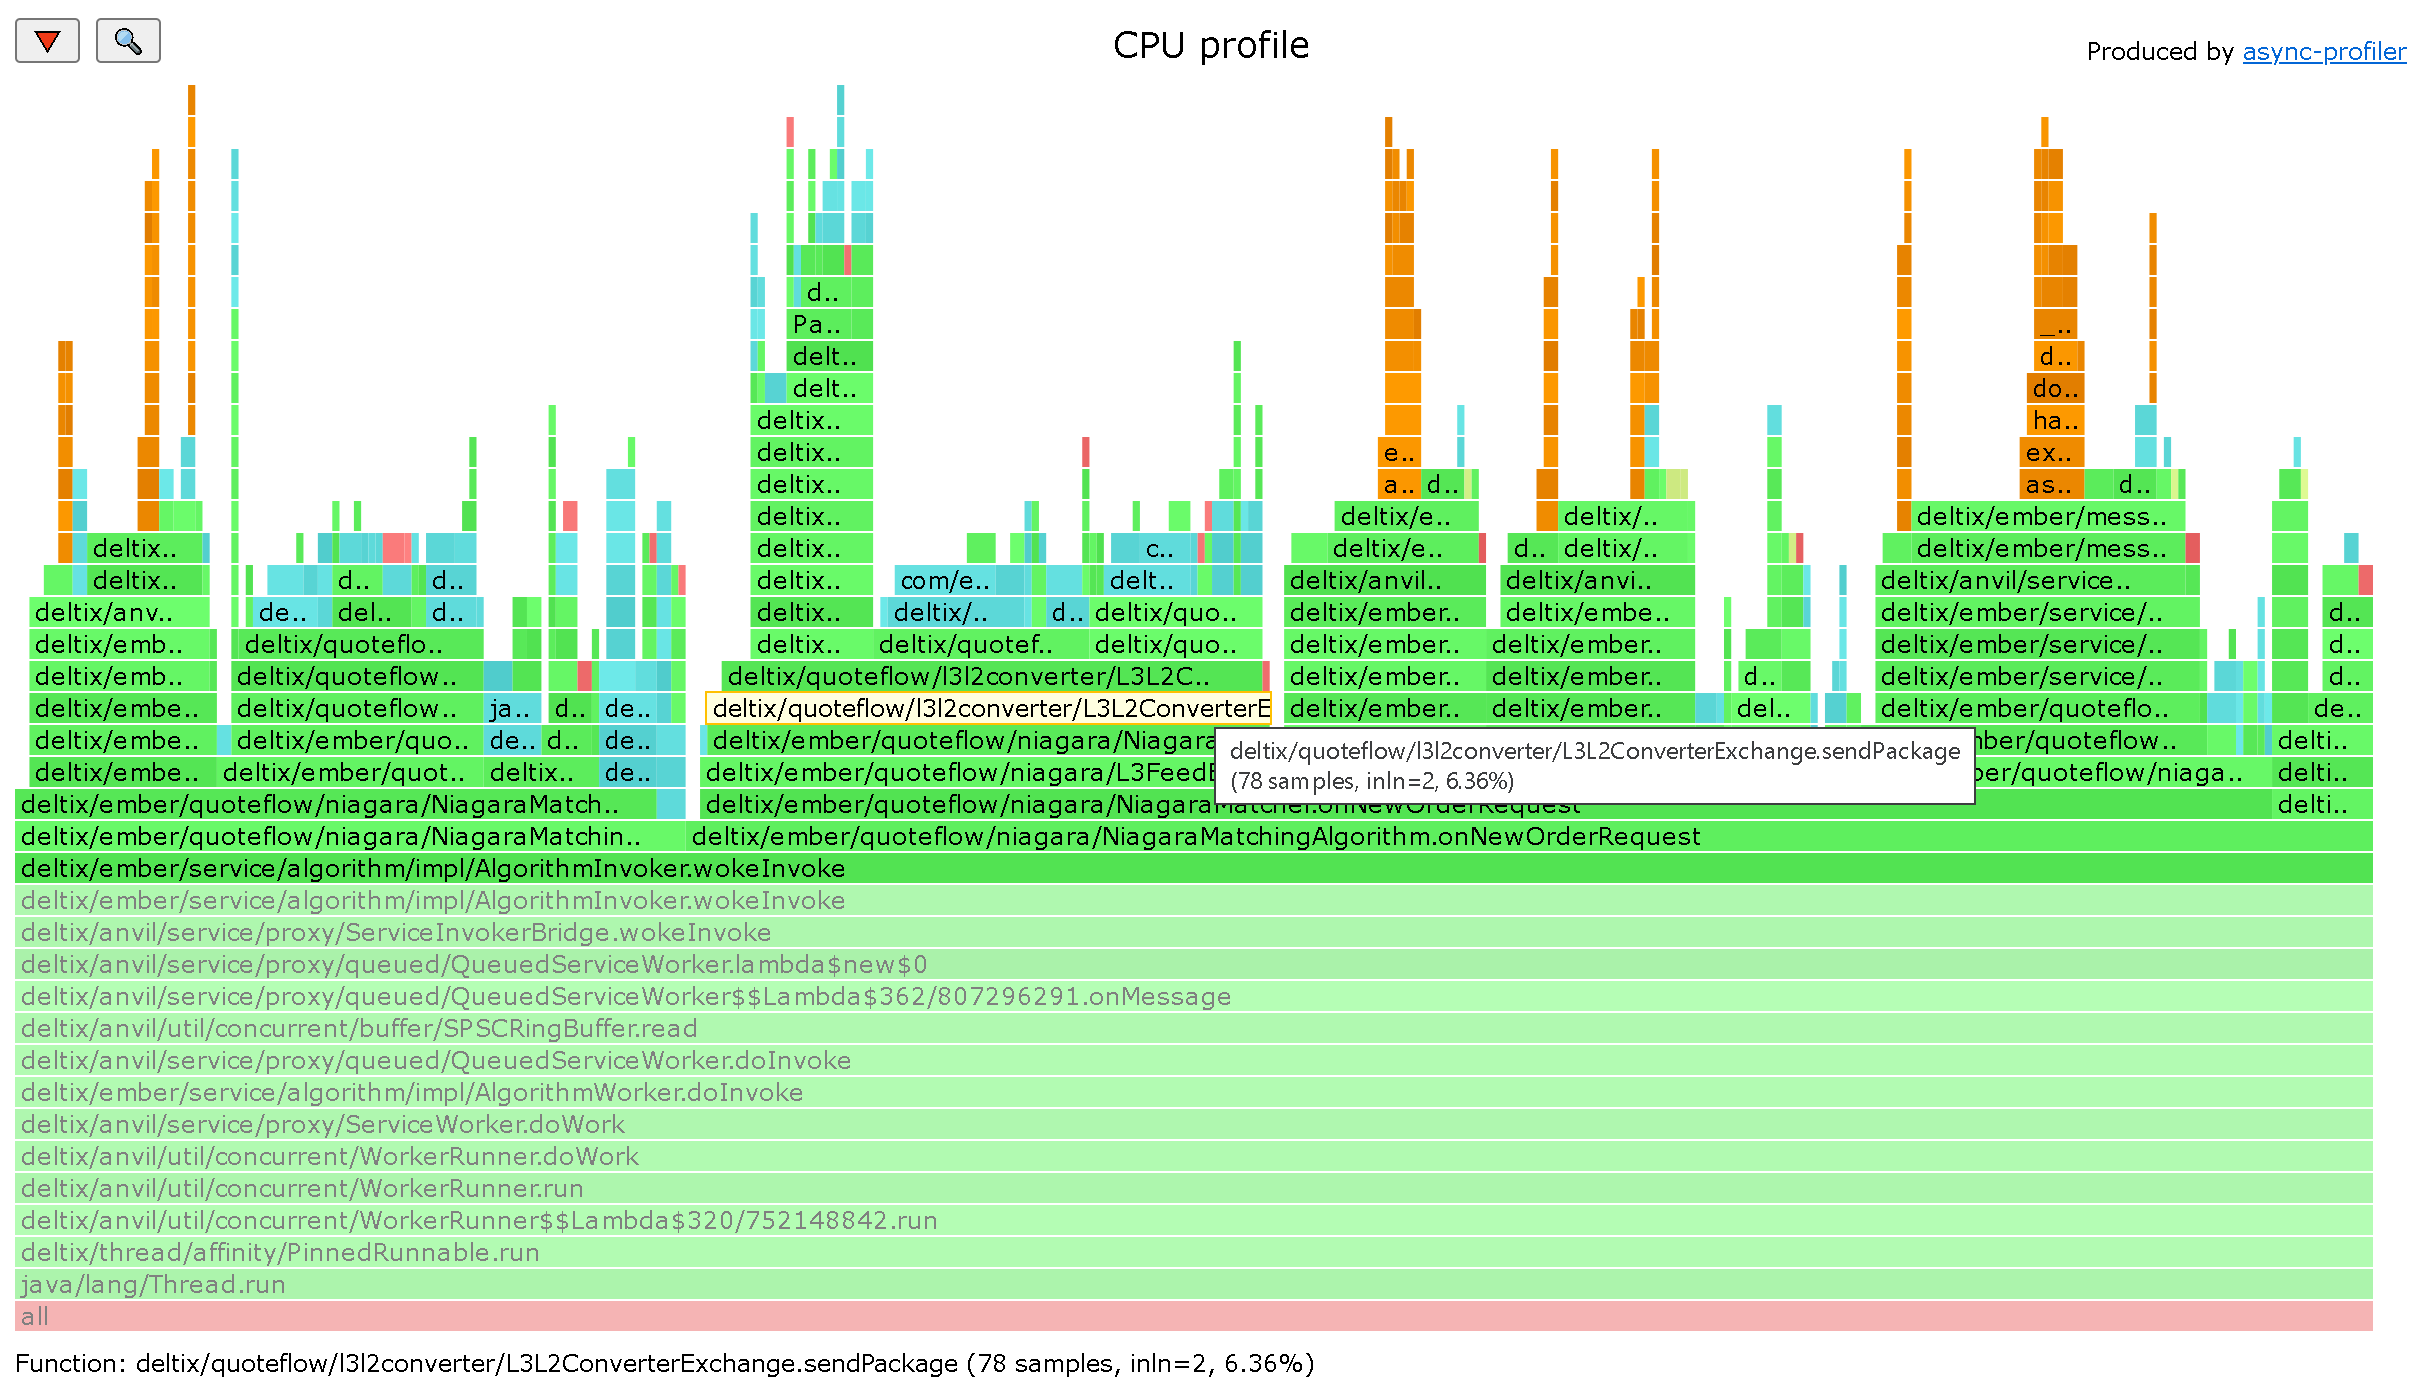
- There are some interesting observation here, for example it takes considerable time to publish market data feed updates when NIAGARA algorithm processes new order request. And bulk of time spent on converting Level 3 feed that NIAGARA emits to Level2 data that is written into TimeBase.
Async Profiler is a great tool written by Andrei Pangin. We encourage you to read tutorials and learn more to troubleshoot performance problems in your Ember algorithms.
Appendix: profiling Ember service running as non-root
Starting from version 1.14 Ember docker service runs as non-root user.
Unfortunately in order to perform profiling you need to revert this. Follow these steps:
- Edit
docker-compose.yaml- Remove or comment out
user: 1666:1666for Aeron and all Ember services - Switch TimeBase service to root user
user: 0:0 - Switch ember service to
-devtag of your ember container:
- Remove or comment out
image: "registry.deltixhub.com/deltix.docker/anvil/deltix-ember:1.14.43-dev"