Latency of Order Bursts
Objective: measure median latency for order bursts.
October 2023
Summary
The primary metrics of our "latency-new" test focus on measuring the order acknowledgement time in scenarios where individual order requests are sent at a consistent rate, specifically at 25,000 order requests per second. This documentation elucidates how Ember handles order bursts. For this experiment, the test setup was adjusted to send orders at a fixed burst rate.
The following diagram summarizes results.
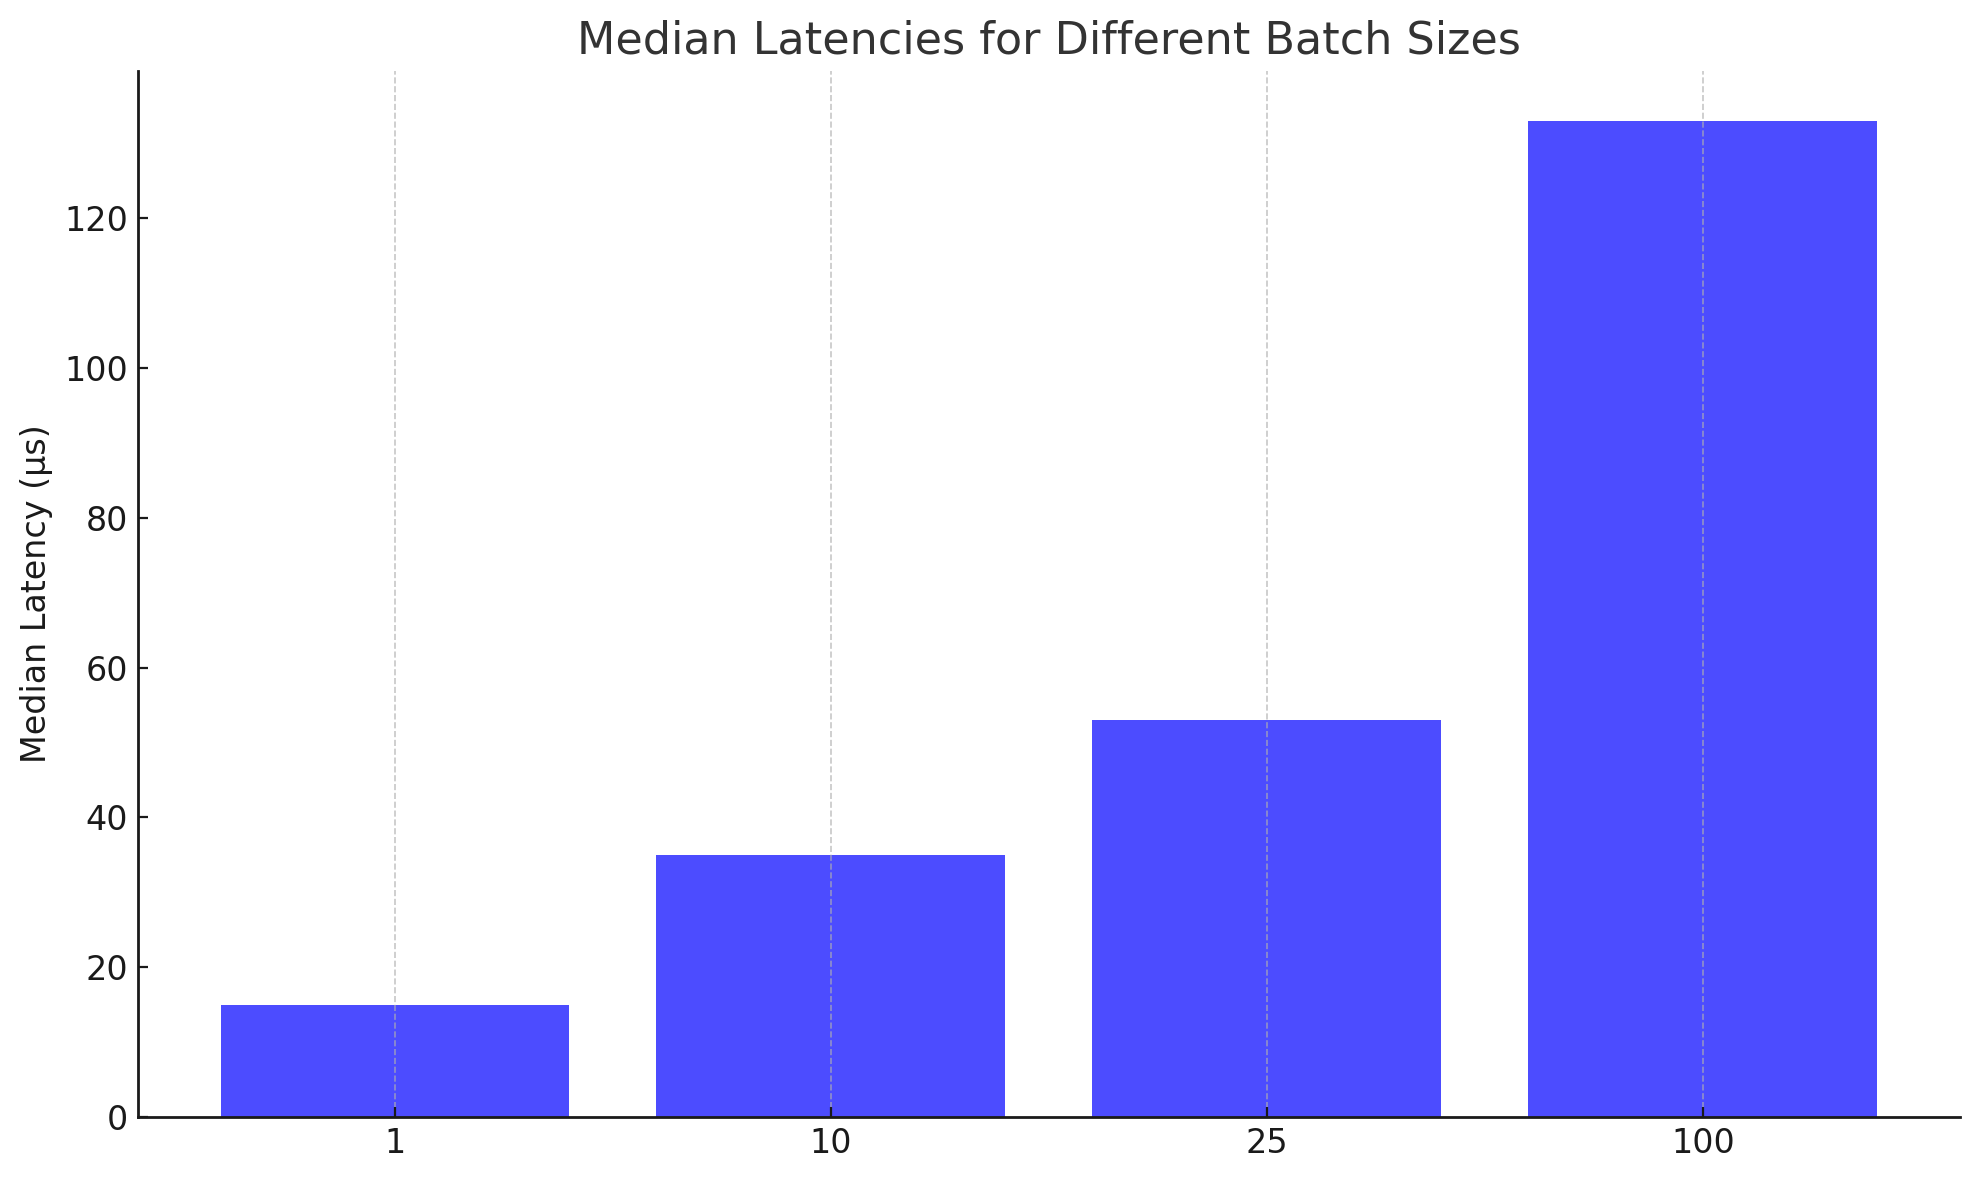
Although the FIX Order Entry Gateway, Ember Engine, Journal Swapper, and NIAGARA matching engine operate concurrently, each of these Ember threads processes incoming requests in a sequential manner. Nonetheless, the benefits of parallelism are evident: the median processing time for a single order is 15 microseconds, while processing 100 orders takes 133 microseconds.
It's important to mention that we are not suggesting batching orders as a means to expedite processing. In real-time trading, it's typically essential to ensure immediate propagation of trading intent.
Environment
Standard latency test was used:
- AWS (terraform-provisioned instances in private vpc)
- NIAGARA Matching Engine
- Test load: 10 FIX clients sending 25000 requests/second in total.
Parameters of FIX Clients were modified to send 1, 10, 25, and 100 order requests at once, while maintaining the same overall order rate of 25K/sec.
Results
Bust of 1 order (baseline)
Percentile : Microseconds : Event count
MIN        :         12.0 :        1978
50.0%      :         15.0 :     1624363
90.0%      :         19.0 :     2268549
99.0%      :         21.0 :     2340535
99.9%      :         27.0 :     2355354
99.99%     :         89.0 :     2357151
99.999%    :        118.0 :     2357367
99.9999%   :        401.0 :     2357385
99.99999%  :        420.0 :     2357387
99.999999% :        420.0 :     2357387
MAX, TOTAL :        420.0 :     2357387
Burst of 10 order requests at once
Run 1:
Percentile : Microseconds : Event count
MIN        :         12.0 :           1
50.0%      :         35.0 :     1176829
90.0%      :         54.0 :     2099495
99.0%      :         76.0 :     2290576
99.9%      :        120.0 :     2311307
99.99%     :        172.0 :     2313348
99.999%    :        201.0 :     2313555
99.9999%   :       4025.0 :     2313577
99.99999%  :       4038.0 :     2313578
99.999999% :       4038.0 :     2313578
MAX, TOTAL :       4038.0 :     2313578
Run 2:
Percentile : Microseconds : Event count
MIN        :         12.0 :           3
50.0%      :         31.0 :     1215046
90.0%      :         48.0 :     2128562
99.0%      :         67.0 :     2318600
99.9%      :         89.0 :     2338731
99.99%     :        121.0 :     2340735
99.999%    :        156.0 :     2340938
99.9999%   :        197.0 :     2340958
99.99999%  :        330.0 :     2340960
99.999999% :        330.0 :     2340960
MAX, TOTAL :        330.0 :     2340960
Run 3:
Percentile : Microseconds : Event count
MIN        :         12.0 :           1
50.0%      :         37.0 :     1241165
90.0%      :         56.0 :     2103535
99.0%      :         80.0 :     2299149
99.9%      :        124.0 :     2318766
99.99%     :        174.0 :     2320831
99.999%    :      19457.0 :     2321037
99.9999%   :      29354.0 :     2321059
99.99999%  :      29355.0 :     2321060
99.999999% :      29355.0 :     2321060
MAX, TOTAL :      29355.0 :     2321060
Burst of 25 order requests at once
Run 1:
Percentile : Microseconds : Event count
MIN        :         13.0 :           1
50.0%      :         53.0 :     1154985
90.0%      :         87.0 :     2084832
99.0%      :        119.0 :     2284830
99.9%      :        162.0 :     2304938
99.99%     :        204.0 :     2306995
99.999%    :        241.0 :     2307196
99.9999%   :        276.0 :     2307217
99.99999%  :        280.0 :     2307219
99.999999% :        280.0 :     2307219
MAX, TOTAL :        280.0 :     2307219
Run 2:
Percentile : Microseconds : Event count
MIN        :         13.0 :           6
50.0%      :         53.0 :     1179603
90.0%      :         87.0 :     2080241
99.0%      :        120.0 :     2274613
99.9%      :        163.0 :     2294960
99.99%     :        204.0 :     2296998
99.999%    :        262.0 :     2297201
99.9999%   :        586.0 :     2297224
99.99999%  :        586.0 :     2297224
99.999999% :        586.0 :     2297224
MAX, TOTAL :        586.0 :     2297224
Run 3:
Percentile : Microseconds : Event count
MIN        :         13.0 :           7
50.0%      :         53.0 :     1151351
90.0%      :         88.0 :     2082638
99.0%      :        120.0 :     2279420
99.9%      :        161.0 :     2299581
99.99%     :        208.0 :     2301633
99.999%    :        239.0 :     2301837
99.9999%   :        368.0 :     2301857
99.99999%  :        371.0 :     2301859
99.999999% :        371.0 :     2301859
MAX, TOTAL :        371.0 :     2301859
Burst of 100 order requests at once
Run 1:
Percentile : Microseconds : Event count
MIN        :         16.0 :           2
50.0%      :        163.0 :     1256261
90.0%      :        247.0 :     2251675
99.0%      :        316.0 :     2470509
99.9%      :        374.0 :     2492043
99.99%     :        458.0 :     2494273
99.999%    :        602.0 :     2494492
99.9999%   :       1530.0 :     2494515
99.99999%  :       1531.0 :     2494517
99.999999% :       1531.0 :     2494517
MAX, TOTAL :       1531.0 :     2494517
Run 2:
Percentile : Microseconds : Event count
MIN        :         16.0 :           2
50.0%      :        133.0 :     1257297
90.0%      :        205.0 :     2247195
99.0%      :        271.0 :     2471952
99.9%      :        332.0 :     2493699
99.99%     :        407.0 :     2495875
99.999%    :        454.0 :     2496099
99.9999%   :        468.0 :     2496123
99.99999%  :        468.0 :     2496123
99.999999% :        468.0 :     2496123
MAX, TOTAL :        468.0 :     2496123