Matching Engine Order Acknowledgement Latency
May 2023 - April 2024
Introduction
This document analyzes an experiment measuring the order acknowledgement latency of a First-In-First-Out (FIFO) matching engine developed on the Ember stack. Data was gathered from an Ember client's live production order traffic during active trading hours.
Results Overview
The table below summarizes how latency improved as the production environment was upgraded over time:
| Date | Change | Median | P99 |
|---|---|---|---|
| May 2023 | Baseline (Beeks server) | 30 μs | 133 μs |
| Nov 2023 | Xilinx ONLOAD kernel bypass | 16 μs | 65 μs |
| Apr 2024 | Modern overclocked CPU | 6 μs | 12 μs |
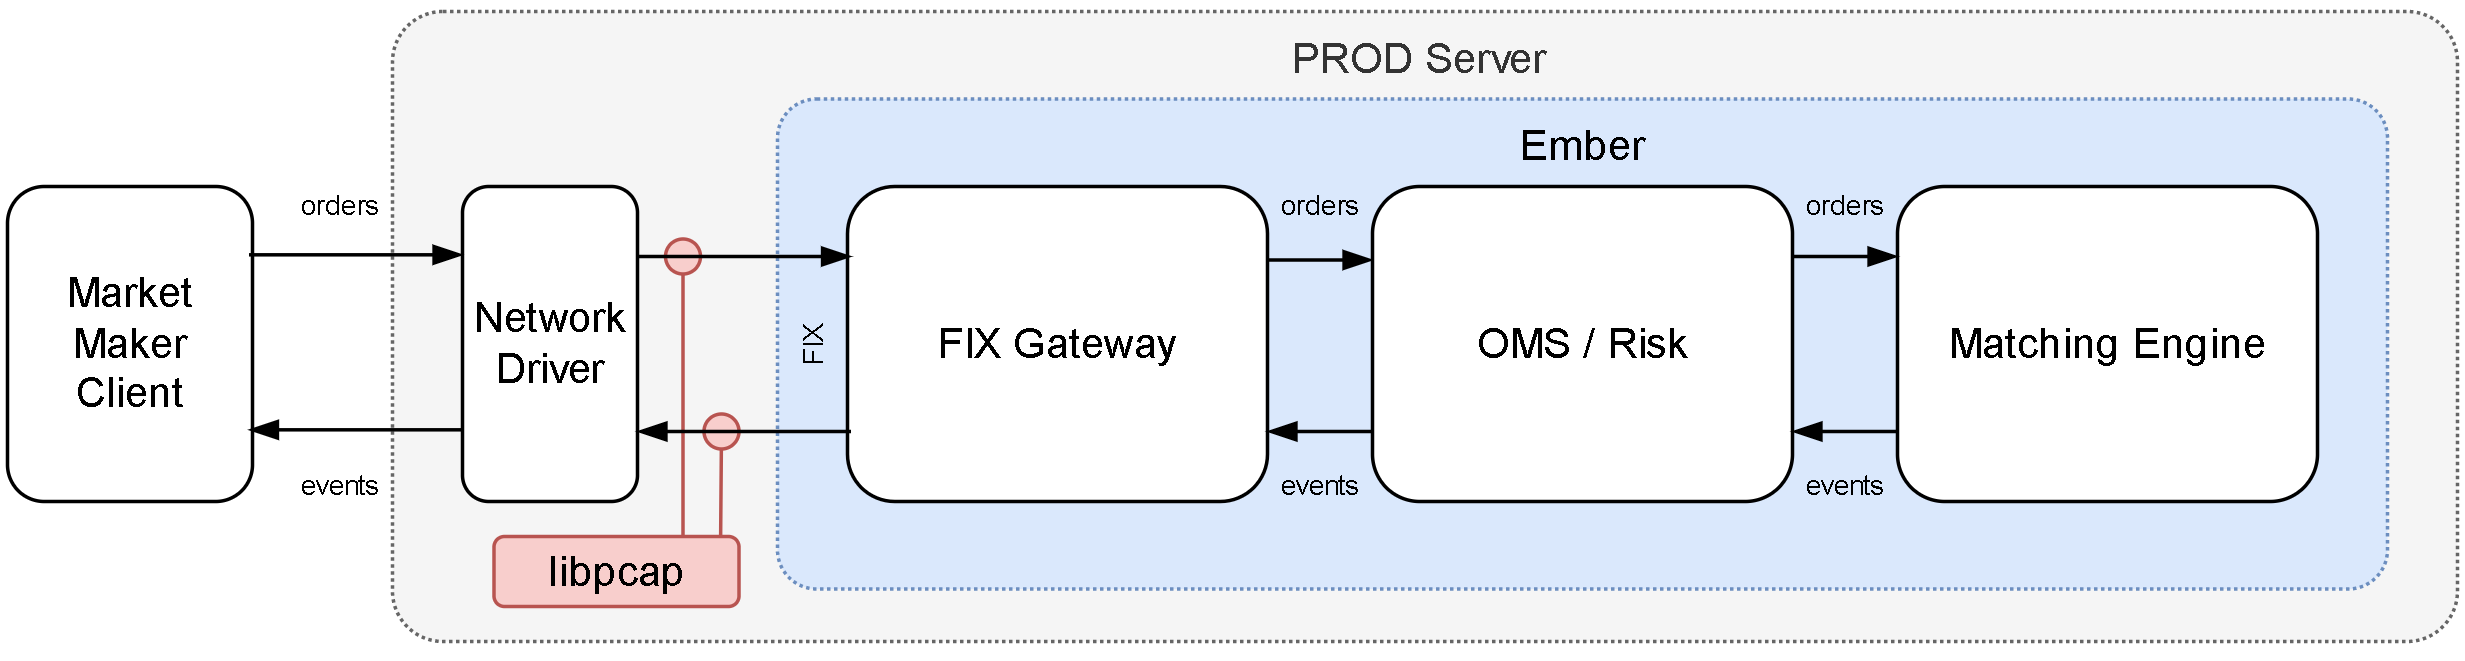
Latency measurements were taken from the point the operating system received the inbound order network packet to the moment the outbound order acknowledgement packet was transmitted, using libpcap to capture FIX messages.
Environment
May 2023 – Baseline
- Hardware - Beeks Platinum server: Single Intel Xeon CPU E5-2695 v4 @ 2.1 GHz (18 physical cores); RAM: 64G; SSD: 480G; Solarflare NIC.
- Operating System (OS) - Ubuntu 22.04 with modified kernel (built with CONFIG_NO_HZ parameter).
- OS Tuning - OS was tuned according to this Linux tuning guide.
- Ember and TimeBase - Running under docker-compose, with host networking mode.
November 2023 – Xilinx ONLOAD (TCP Bypass)
Identical hardware and software stack as the May 2023 baseline. The only change was switching to the Xilinx ONLOAD driver, enabling kernel-bypass TCP on the Solarflare NIC.
March 2024 – Modern Overclocked Server
- Hardware - Client-owned ICC VEGA R-118I server, collocated at Beeks: Intel® Xeon® w7-2495X @ 4.8GHz; RAM: 128 GB DDR-5; Storage: 2 × Crucial P3 Plus 4TB PCIe M.2 2280 SSD (Linux software RAID-1); Solarflare XtremeScale SFC9250 NIC.
- Operating System (OS) - RHEL 8.9, configured via Ansible playbook.
- OpenOnload - version 8.1.1.17 (kernel-bypass TCP, same as November 2023).
- Ember and TimeBase - Same docker-compose setup as baseline.
Measurement Details
Order acknowledgement latency is defined as the time elapsed between the receipt of a FIX message containing order-related requests on our end and the subsequent issuance of our initial response.
We gathered results from 8:30 AM to 12:00 PM (UTC-4). During this period, we captured metrics for approximately 111,000 orders from a single market maker.
Our latency measurement tool captured network packets using libpcap API. For each inbound packet containing a FIX message with a new order request, the tool establishes correlation with an outbound packet (containing order ACK FIX message for the same order). The difference in Linux kernel-provided timestamps of these packets gave us order ACK latency of each individual order. During our test we were able to collect measurements for 111K production orders. HDR Histogram was used to calculate latency percentiles. A simplified version of this tool is available here.
The diagram below is a visual representation of the latency testing process:
Detailed Results
The vast majority of the observed network traffic consisted of FIX Order Replace Request messages (35=G), accompanied by a smaller number of Order New Requests (35=D) and Order Cancel Requests (35=F).
Each of these requests typically prompted one or more response Execution Report messages (35=8). For instance, an order could result in an initial acknowledgement (150=0), followed by several Execution Report messages (150=F).
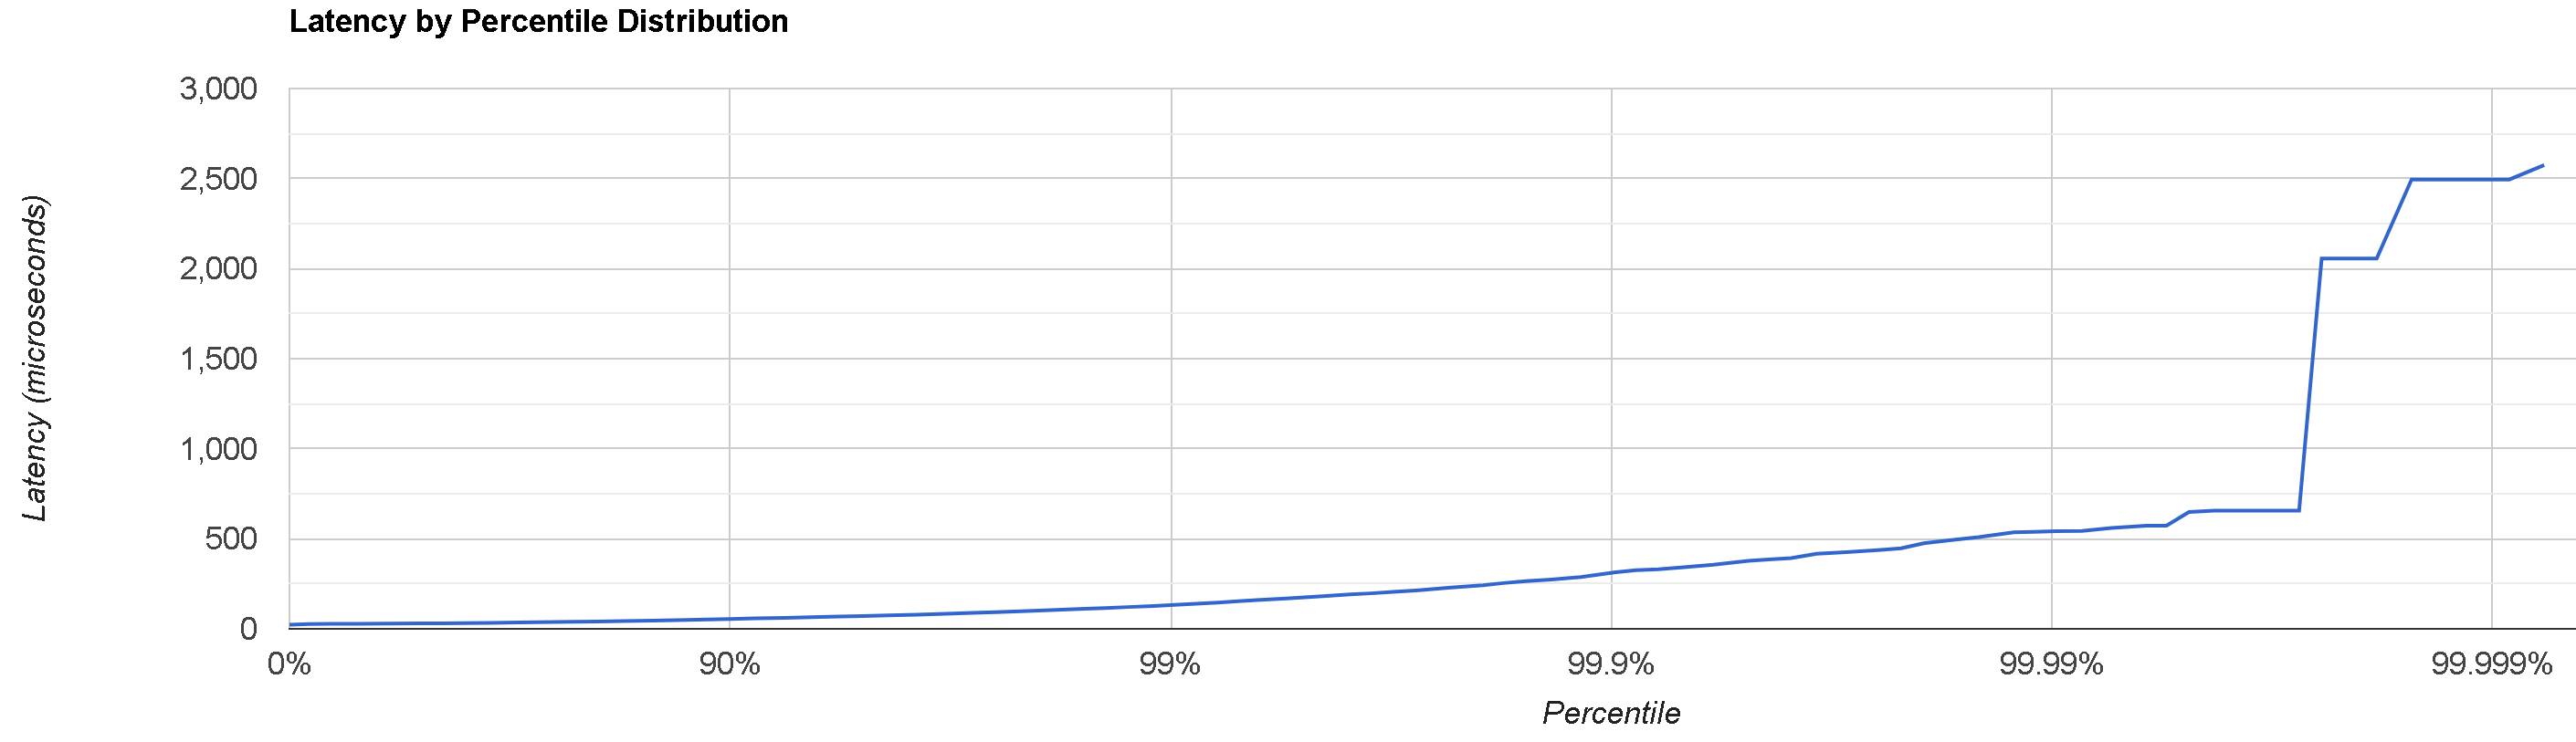
The following table contains the latency histogram, with times shown in microseconds:
Percentile : Microseconds : Event count
MIN        :         23.0 :           6
50.0%      :         30.0 :       57761
90.0%      :         55.0 :      100940
99.0%      :        133.0 :      110655
99.9%      :        310.0 :      111638
99.99%     :        538.0 :      111738
99.999%    :       2495.0 :      111748
99.9999%   :       2575.0 :      111749
99.99999%  :       2575.0 :      111749
99.999999% :       2575.0 :      111749
MAX, TOTAL :       2575.0 :      111749
The same results shown in chart format:
Comparison with AWS-Based Benchmark
Deltix has an internal performance benchmark that measures a similar order acknowledgement latency in an AWS-based configuration. In this setup, the matching engine is fed with 20,000 order requests per second from 10 FIX-based bots that simulate real clients.
Here is a sample result, based on a dataset of 2.2 million orders:
Percentile : Microseconds : Event count
MIN        :         13.0 :         117
50.0%      :         22.0 :     1166665
90.0%      :         71.0 :     2028273
99.0%      :        100.0 :     2225310
99.9%      :        129.0 :     2244197
99.99%     :        157.0 :     2246105
99.999%    :        183.0 :     2246294
99.9999%   :        797.0 :     2246314
99.99999%  :        992.0 :     2246316
99.999999% :        992.0 :     2246316
MAX, TOTAL :        992.0 :     2246316
The AWS environment offers better CPUs (c5d.12xlarge with Intel Xeon Platinum 8275CL CPU @ 3.00GHz) that result in better mean time but lead to more jitter.
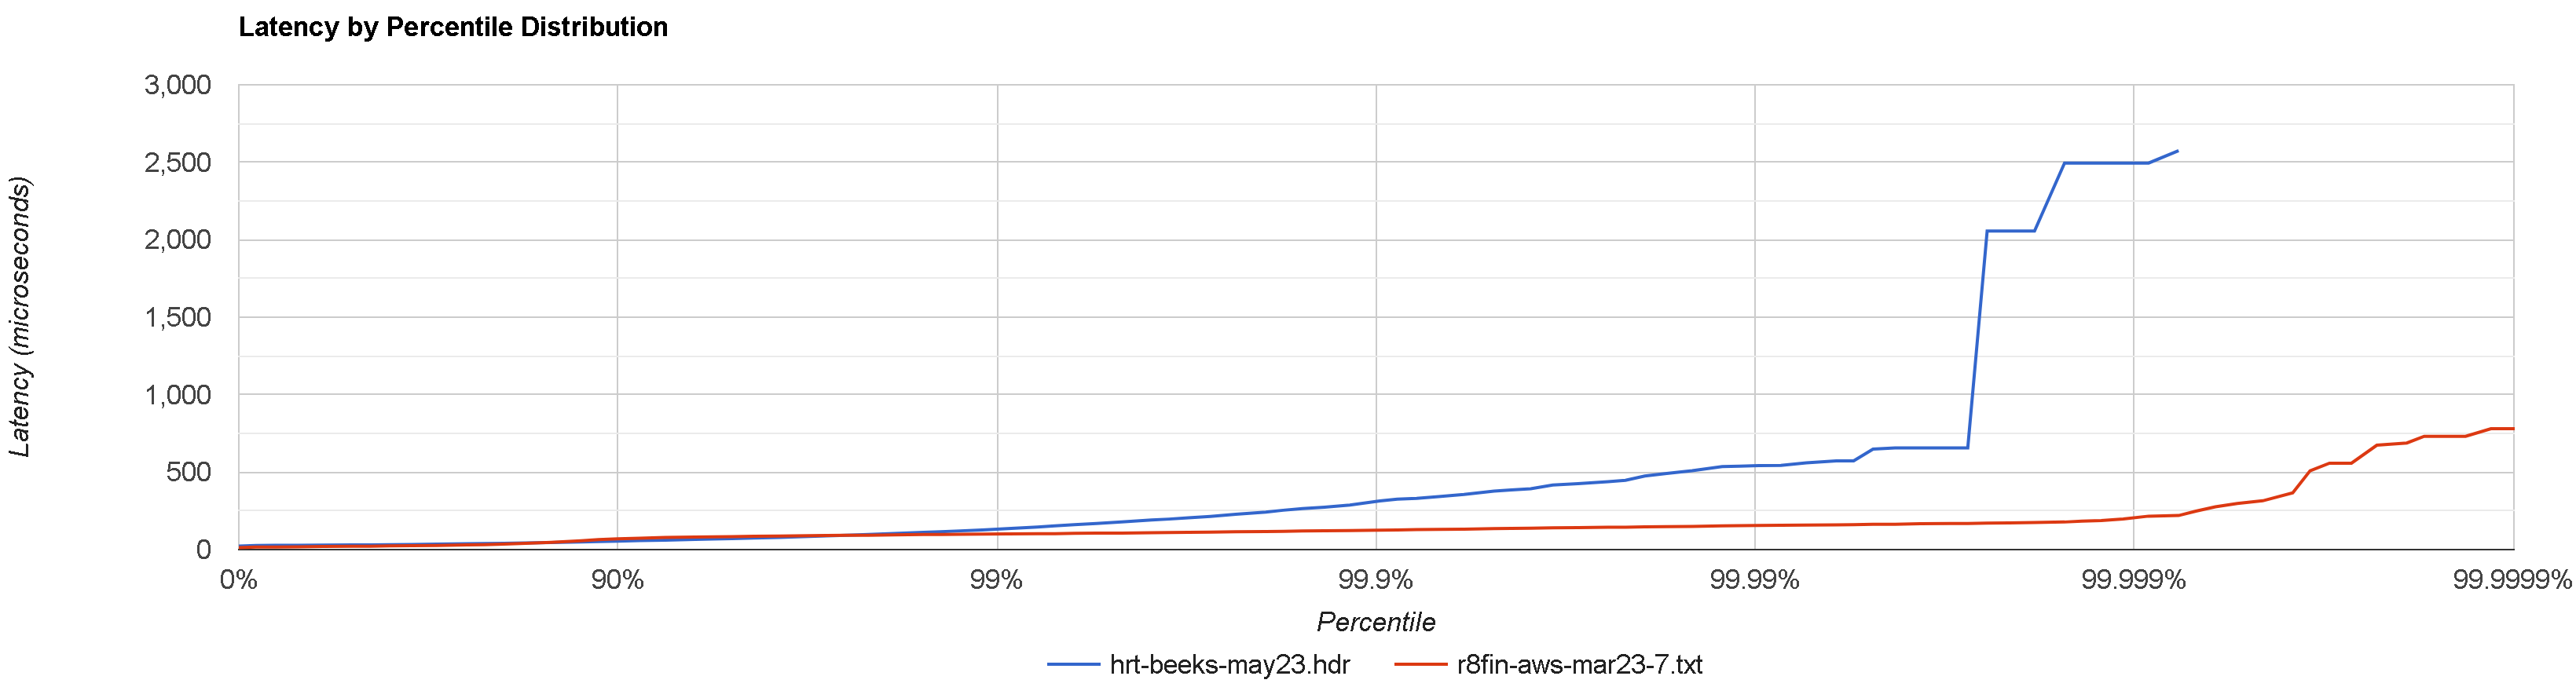
The following histogram chart compares the latency results between the production environment at Beeks (blue) and the AWS test environment (red), with lower values indicating better performance:
Optimization History & Roadmap
Completed
TCP Bypass
The setup was upgraded to run under Xilinx ONLOAD driver (November 2023). Results:
| Percentile | Latency (μs) |
|---|---|
| MIN | 13 |
| 50.0% | 24 |
| 90.0% | 54 |
| 99.0% | 247 |
| 99.9% | 476 |
| 99.99% | 746 |
| 99.999% | 746 |
| 99.9999% | 746 |
| 99.99999% | 746 |
| 99.999999% | 746 |
| MAX, TOTAL | 746 |
Upgrade to a Modern, Overclocked CPU
The benchmark results from the AWS-based setup indicated that achieving an average order acknowledgement time as low as 12 microseconds was possible with more advanced CPUs. Production was upgraded to a modern server with Intel® Xeon® w7-2495X running at 4.8GHz (March 2024). Results:
| Percentile | Latency (μs) |
|---|---|
| MIN | 4 |
| 50.0% | 6 |
| 90.0% | 8 |
| 99.0% | 12 |
| 99.9% | 27 |
| 99.99% | 90 |
| 99.999% | 171 |
| 99.9999% | 247 |
| 99.99999% | 247 |
| 99.999999% | 247 |
| MAX, TOTAL | 247 |
Pending
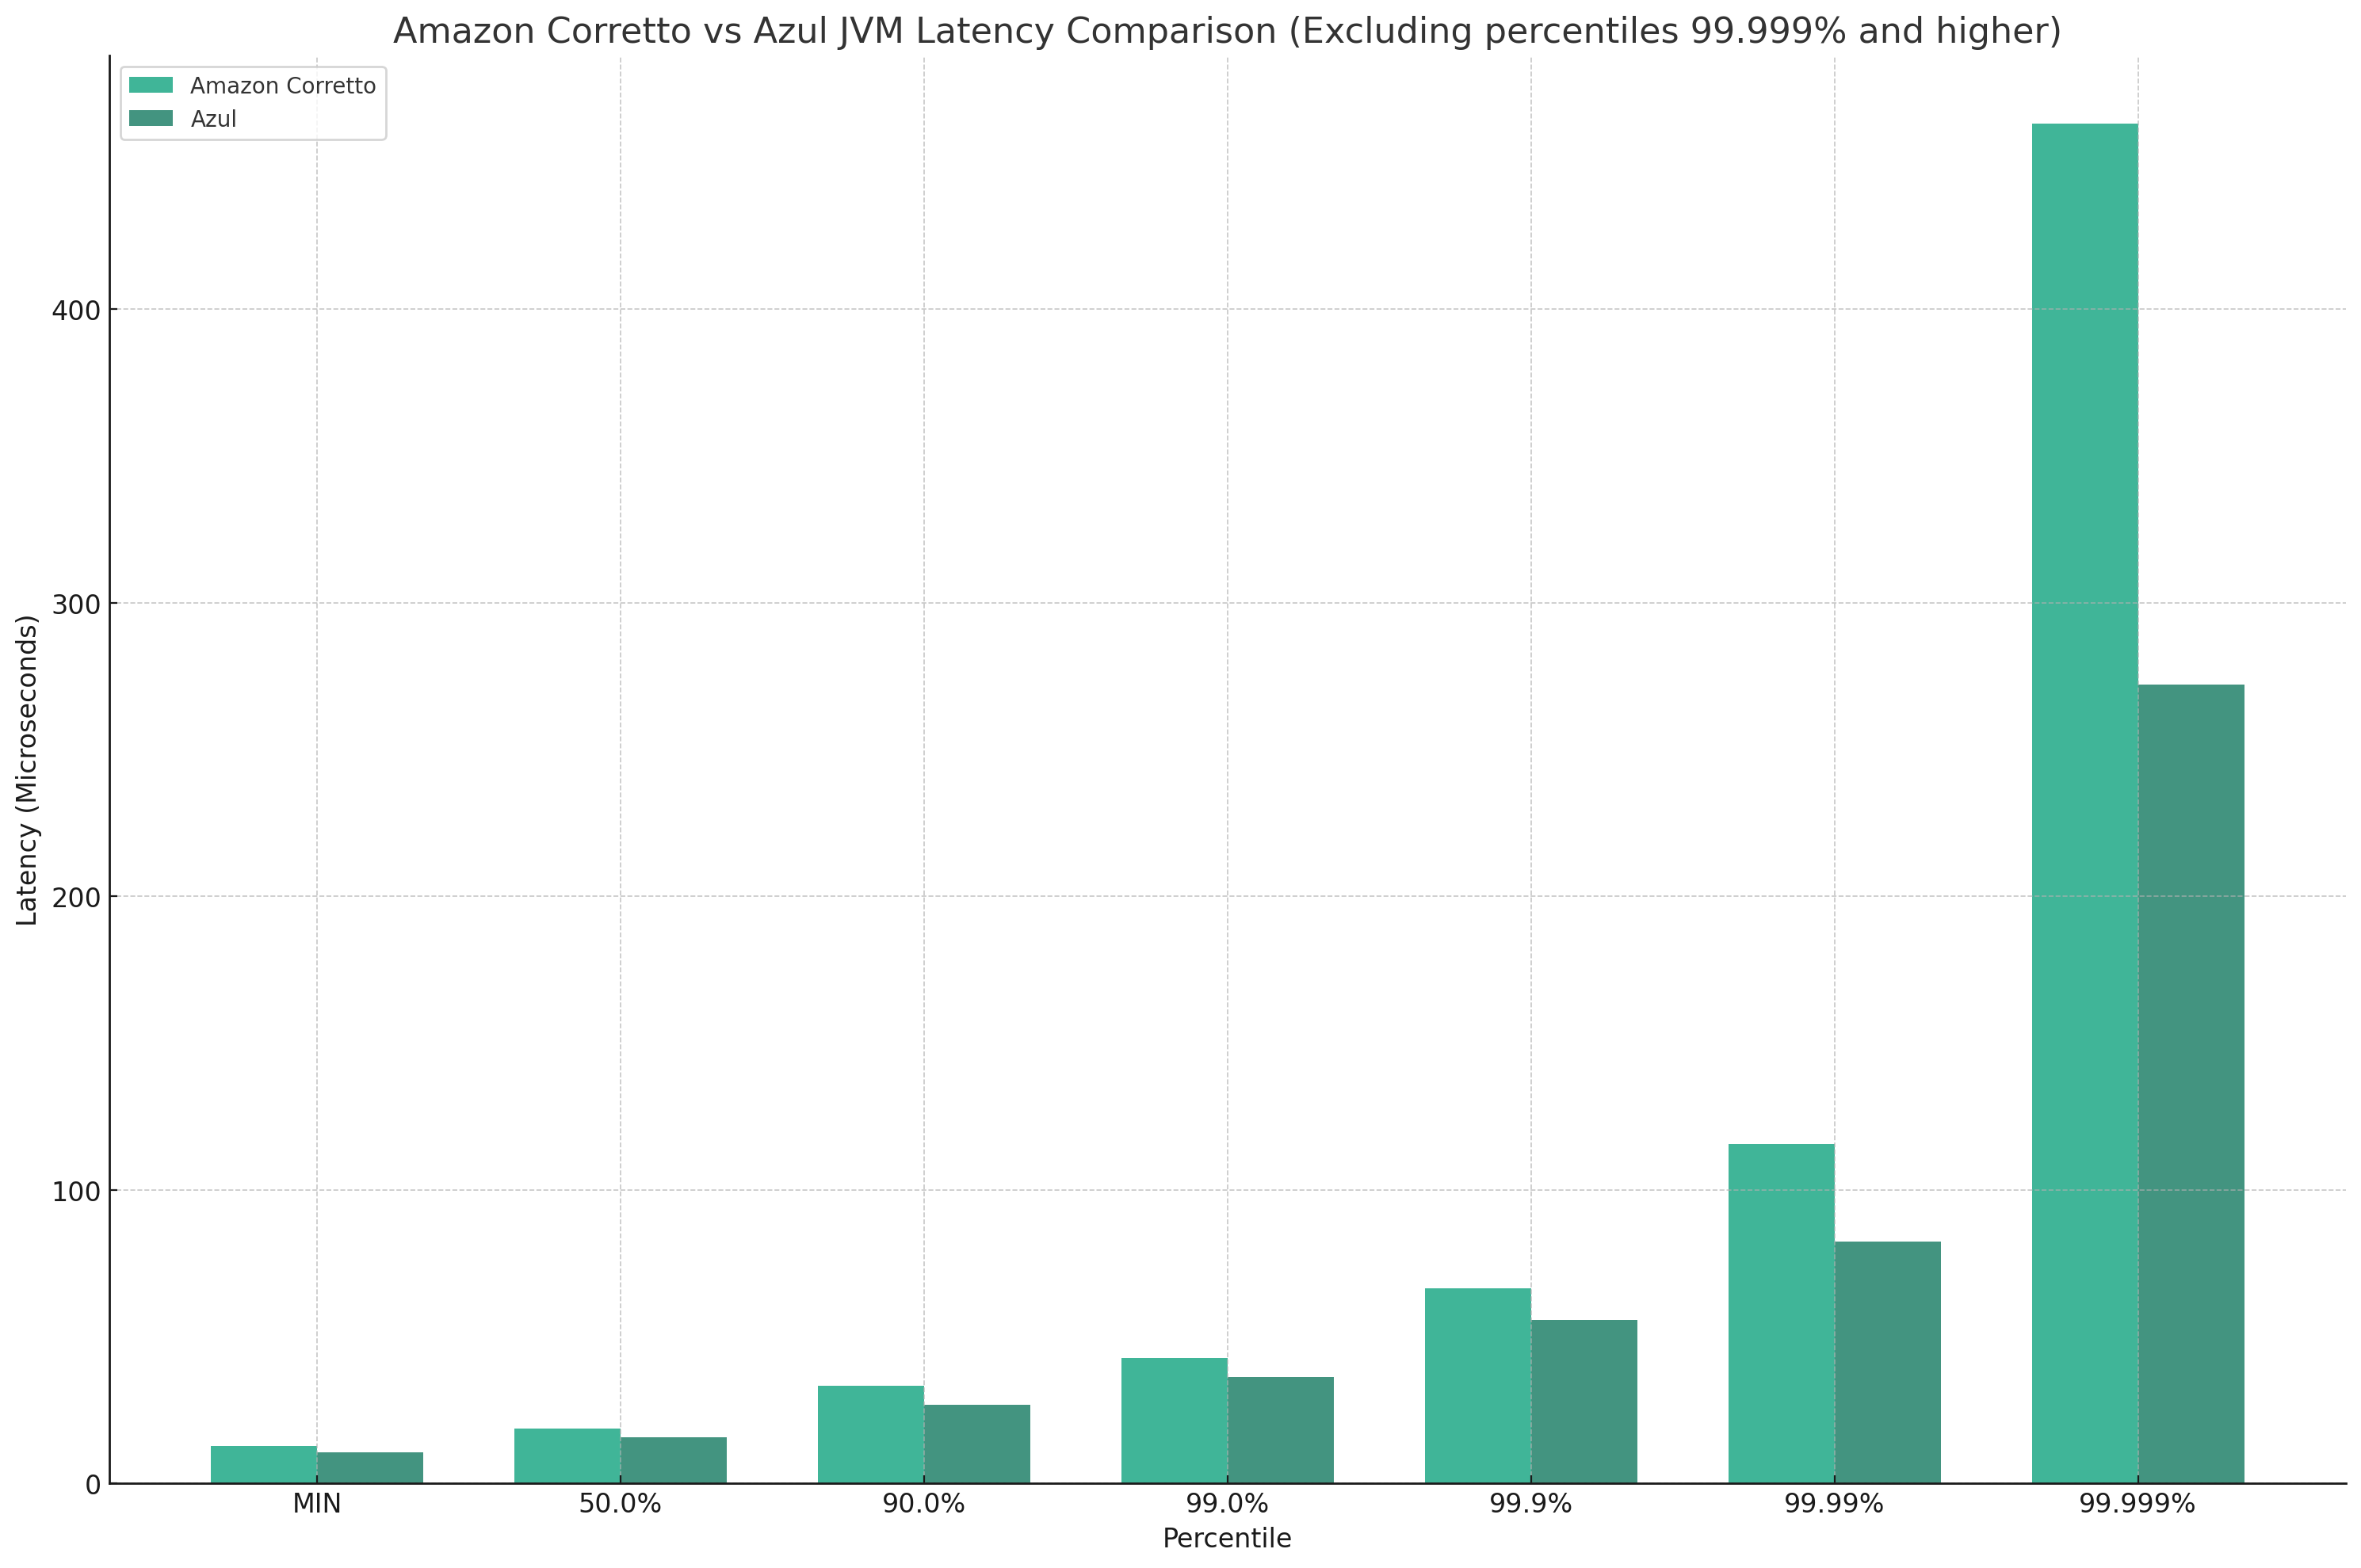
Switch to Commercial JVM with Better JIT
Our order ACK latency benchmark shows that switching from OpenJDK to GraalVM Enterprise or Azul Zulu Prime improves latency metrics by about 16%:
Custom Architecture
We can effectively bypass Ember's generic OMS by allowing the matching engine to operate independently instead of running within the custom algorithm. This adjustment eradicates two queue hops for the signals under observation, leading to a more streamlined process.