Running Ember with Xilinx Onload TCP Bypass on overclocked hardware
Author: Valery Svistunou March 2024
Preface
Switching to Xilinx Onload, as described in this article, allowed us to significantly reduce matching engine latency. Recently we got a chance to improve this result even more by running order acknowledgement latency test on a newer server with overclocked CPU. This article describes testing conditions and new testing results.
Hardware and software configuration
The test has been executed on the new ICC VEGA R-118I server with the following specifications:
- Intel® Xeon® w7-2495X @ 4.8Ghz
- 128 Gb DDR-5
- 2 * Crucial P3 Plus 4TB PCIe M.2 2280 SSD (Linux software RAID-1)
- Solarflare Communications XtremeScale SFC9250 10/25/40/50/100G Ethernet Controller
The server had RHEL 8.9 installed, with additional configuration done via our Ansible playbook. We also used OpenOnload version 8.1.1.17.
Test description and results
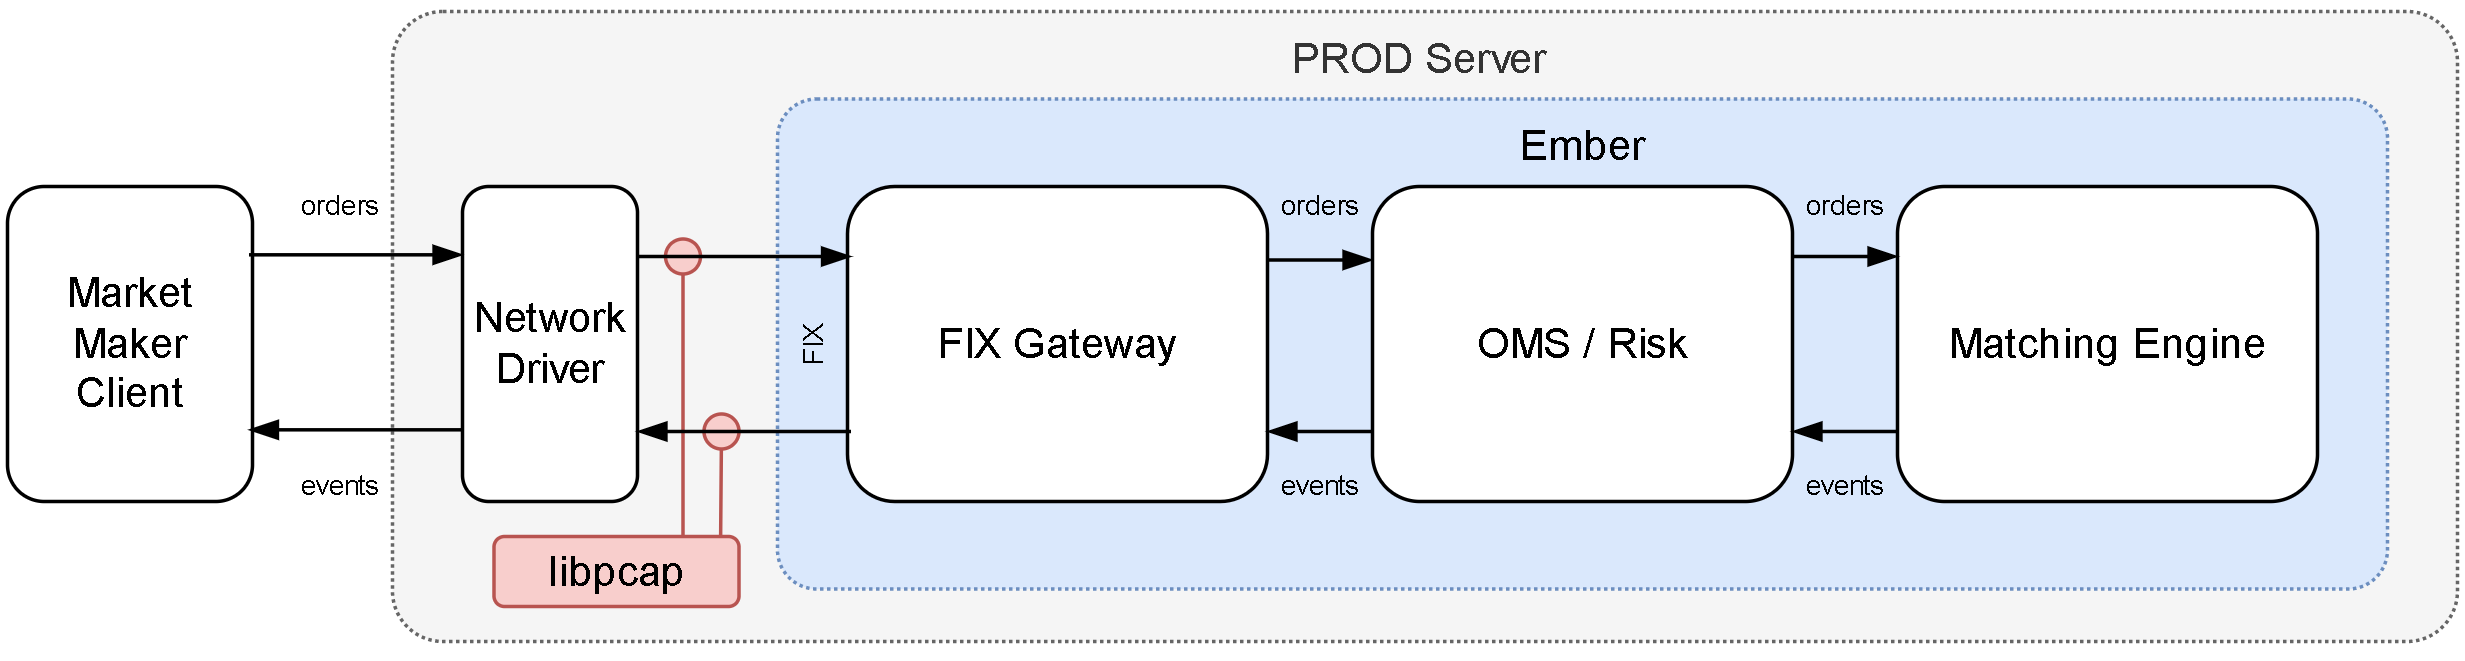
During the test we ran a group of trading clients producing 23000 of trade messages per second, and a group of 10 market data consumers. Our goal was to measure latency between a trading message coming to Ember and a corresponding market data message. An Ember instance was running on the server, described above, and all client instances were running on a separate VM instance. Both the server and the VM were connected to the same L2 network. The latency was calculated based on capture files of network interactions between the clients and the server.
We ran 3 rounds of this test without Onload and 3 rounds more with Onload and got the results following:
Onload disabled
Round 1:
--------   Latency IN -> OUT   --------
Percentile : Microseconds : Event count
MIN        :          5.0 :          21
50.0%      :          8.0 :     1549449
90.0%      :         10.0 :     2002120
99.0%      :         16.0 :     2138541
99.9%      :         24.0 :     2152480
99.99%     :         55.0 :     2154354
99.999%    :         84.0 :     2154538
99.9999%   :         98.0 :     2154559
99.99999%  :        101.0 :     2154560
99.999999% :        101.0 :     2154560
MAX, TOTAL :        101.0 :     2154560
Round 2:
--------   Latency IN -> OUT   --------
Percentile : Microseconds : Event count
MIN        :          5.0 :         124
50.0%      :          7.0 :     1344722
90.0%      :          9.0 :     2080990
99.0%      :         12.0 :     2229827
99.9%      :         19.0 :     2244708
99.99%     :         57.0 :     2246694
99.999%    :         90.0 :     2246888
99.9999%   :        179.0 :     2246908
99.99999%  :        440.0 :     2246910
99.999999% :        440.0 :     2246910
MAX, TOTAL :        440.0 :     2246910
Round 3:
--------   Latency IN -> OUT   --------
Percentile : Microseconds : Event count
MIN        :          5.0 :         200
50.0%      :          7.0 :     1094017
90.0%      :         10.0 :     2044137
99.0%      :         14.0 :     2129513
99.9%      :         21.0 :     2146792
99.99%     :         47.0 :     2148628
99.999%    :        135.0 :     2148819
99.9999%   :        358.0 :     2148837
99.99999%  :        680.0 :     2148839
99.999999% :        680.0 :     2148839
MAX, TOTAL :        680.0 :     2148839
Onload enabled
Round 1:
--------   Latency IN -> OUT   --------
Percentile : Microseconds : Event count
MIN        :          4.0 :       94269
50.0%      :          5.0 :     1217021
90.0%      :          7.0 :     2100675
99.0%      :          9.0 :     2153050
99.9%      :         14.0 :     2163163
99.99%     :         46.0 :     2164814
99.999%    :         89.0 :     2165001
99.9999%   :        221.0 :     2165021
99.99999%  :        685.0 :     2165023
99.999999% :        685.0 :     2165023
MAX, TOTAL :        685.0 :     2165023
Round 2:
--------   Latency IN -> OUT   --------
Percentile : Microseconds : Event count
MIN        :          4.0 :      111992
50.0%      :          5.0 :     1278027
90.0%      :          7.0 :     2108129
99.0%      :          9.0 :     2164314
99.9%      :         15.0 :     2182662
99.99%     :         50.0 :     2184402
99.999%    :         83.0 :     2184584
99.9999%   :        126.0 :     2184603
99.99999%  :        134.0 :     2184605
99.999999% :        134.0 :     2184605
MAX, TOTAL :        134.0 :     2184605
Round 3:
--------   Latency IN -> OUT   --------
Percentile : Microseconds : Event count
MIN        :          4.0 :      113778
50.0%      :          5.0 :     1298747
90.0%      :          7.0 :     2119728
99.0%      :          8.0 :     2147239
99.9%      :         13.0 :     2156298
99.99%     :         50.0 :     2157946
99.999%    :         85.0 :     2158137
99.9999%   :        102.0 :     2158157
99.99999%  :        122.0 :     2158159
99.999999% :        122.0 :     2158159
MAX, TOTAL :        122.0 :     2158159
Conclusion
To summarize, the benchmarks provided indisputable evidence that upgrading to high-end hardware enhances performance dramatically. In this study, latency was reduced to a record value of 5 microseconds, showcasing a significant improvement when using overclocked CPU and running Xilinx Onload TCP Bypass. The potential of such high-end systems should not be underestimated as they continue to render impressive results in performance testing.
Appendix
This section contains information on various system's settings.
lscpu output
General information (note: CPU MHz reports wrong value, actual speed was 4800MHz)
$ lscpu
Architecture:        x86_64
CPU op-mode(s):      32-bit, 64-bit
Byte Order:          Little Endian
CPU(s):              24
On-line CPU(s) list: 0-23
Thread(s) per core:  1
Core(s) per socket:  24
Socket(s):           1
NUMA node(s):        1
Vendor ID:           GenuineIntel
CPU family:          6
Model:               143
Model name:          Intel(R) Xeon(R) w7-2495X
Stepping:            8
CPU MHz:             2501.000
CPU max MHz:         2501.0000
CPU min MHz:         800.0000
BogoMIPS:            4992.00
L1d cache:           48K
L1i cache:           32K
L2 cache:            2048K
L3 cache:            46080K
NUMA node0 CPU(s):   0-23
Information about physical CPU architecture
$ lscpu -p
# The following is the parsable format, which can be fed to other
# programs. Each different item in every column has an unique ID
# starting from zero.
# CPU,Core,Socket,Node,,L1d,L1i,L2,L3
0,0,0,0,,0,0,0,0
1,1,0,0,,1,1,1,0
2,2,0,0,,2,2,2,0
3,3,0,0,,3,3,3,0
4,4,0,0,,4,4,4,0
5,5,0,0,,5,5,5,0
6,6,0,0,,6,6,6,0
7,7,0,0,,7,7,7,0
8,8,0,0,,8,8,8,0
9,9,0,0,,9,9,9,0
10,10,0,0,,10,10,10,0
11,11,0,0,,11,11,11,0
12,12,0,0,,12,12,12,0
13,13,0,0,,13,13,13,0
14,14,0,0,,14,14,14,0
15,15,0,0,,15,15,15,0
16,16,0,0,,16,16,16,0
17,17,0,0,,17,17,17,0
18,18,0,0,,18,18,18,0
19,19,0,0,,19,19,19,0
20,20,0,0,,20,20,20,0
21,21,0,0,,21,21,21,0
22,22,0,0,,22,22,22,0
23,23,0,0,,23,23,23,0
Kernel boot parameters
$ cat /proc/cmdline
BOOT_IMAGE=(mduuid/7253769fb510dcc1b5403e83a29adf42)/boot/vmlinuz-4.18.0-513.18.1.el8_9.x86_64 root=UUID=e495b8ae-91ab-466d-86de-0a89df05f4a5 ro rd.md.uuid=7253769f:b510dcc1:b5403e83:a29adf42 rhgb quiet transparent_hugepage=never intel_pstate=disable intel_idle.max_cstate=0 processor.max_cstate=0 mce=ignore_ce nosoftlockup=0 audit=0 idle=poll nmi_watchdog=0 mitigations=off isolcpus=14-23 nohz_full=14-23 rcu_nocbs=14-23 selinux=0
Ember affinity config
ember.conf:
    message-bus               = [14]
    trade-gwy-trans-TGW1      = [15]
    trade-gwy-sess-TGW1       = [16]
    marketdata-gwy-trans-MGW1 = [17]
    marketdata-gwy-sess-MGW1  = [18]
    trade-engine              = [19]
    journal-swapper           = [20]
    algorithm-NIAGARA         = [21]

    # used by aeron media driver container
    aeron-driver-shared       = [22]

    #non-critical:
    timebase-client                      = [10,11,12,13]
    aeron-client-conductor               = [10,11,12,13]
    message-bus-input-dispatcher         = [10,11,12,13]
    logger                               = [10,11,12,13]
    instrument-updater                   = [10,11,12,13]
    CentralSMD                           = [10,11,12,13]
    LocalSMStorage Flusher Thread 1      = [10,11,12,13]
    fix-agent                            = [10,11,12,13]
Clients configuration
Trading client:
$ java -cp fixtest/efix-samples.jar --add-opens=java.base/sun.nio.ch=ALL-UNNAMED deltix.efix.endpoint.FixedRateTradeMultiClient -count 10 -host 192.0.2.1 -basePort 12001 -baseClientId 1 -symbols BTCUSD,LTCUSD,ETHUSD,LTCBTC,BCHUSD,BCHBTC,ETHBTC,XRPUSD -compIdPrefix TUSER -tsNanos -rate 2750 -threads 1 -affinity 2,3 -activeOrdersWindow 2000
Market data client:
$ java -cp fixtest/efix-samples.jar --add-opens=java.base/sun.nio.ch=ALL-UNNAMED deltix.efix.endpoint.MarketMultiClientSample -count 10 -host 192.0.2.1 -basePort 10001 -baseClientId 1 -symbols BTCUSD,LTCUSD,ETHUSD,LTCBTC,BCHUSD,BCHBTC,ETHBTC,XRPUSD -compIdPrefix DUSER -incremental -threads 2 -affinity 0,1