Order to Tick Latency
Order to Tick Latency
October 2023
This document outlines the benchmarking of the order-to-tick latency for a FIX Market Data Gateway. Specifically, it measures the latency from the instant an inbound network packet, containing a user order, enters the TCP stack to the moment an outbound TCP packet signifies a market data change, either as a passive quote or trade. In both scenarios, we intercept FIX messages.
Draft
Summary
The median order-to-tick latency, across 10 FIX clients, was 42 microseconds. This metric measure timestamp difference between the TCP packet containing the FIX order and the packet with the corresponding order book update in the FIX message.
November 2023 Update: above results were obtained on realistic benchmark running on AWS. Based on these findings we were able to achieve median order-to-tick latency of 20 microseconds on client production environment (largely due to TCP bypass provided by Xilinx Onload).
Market Making Exchange
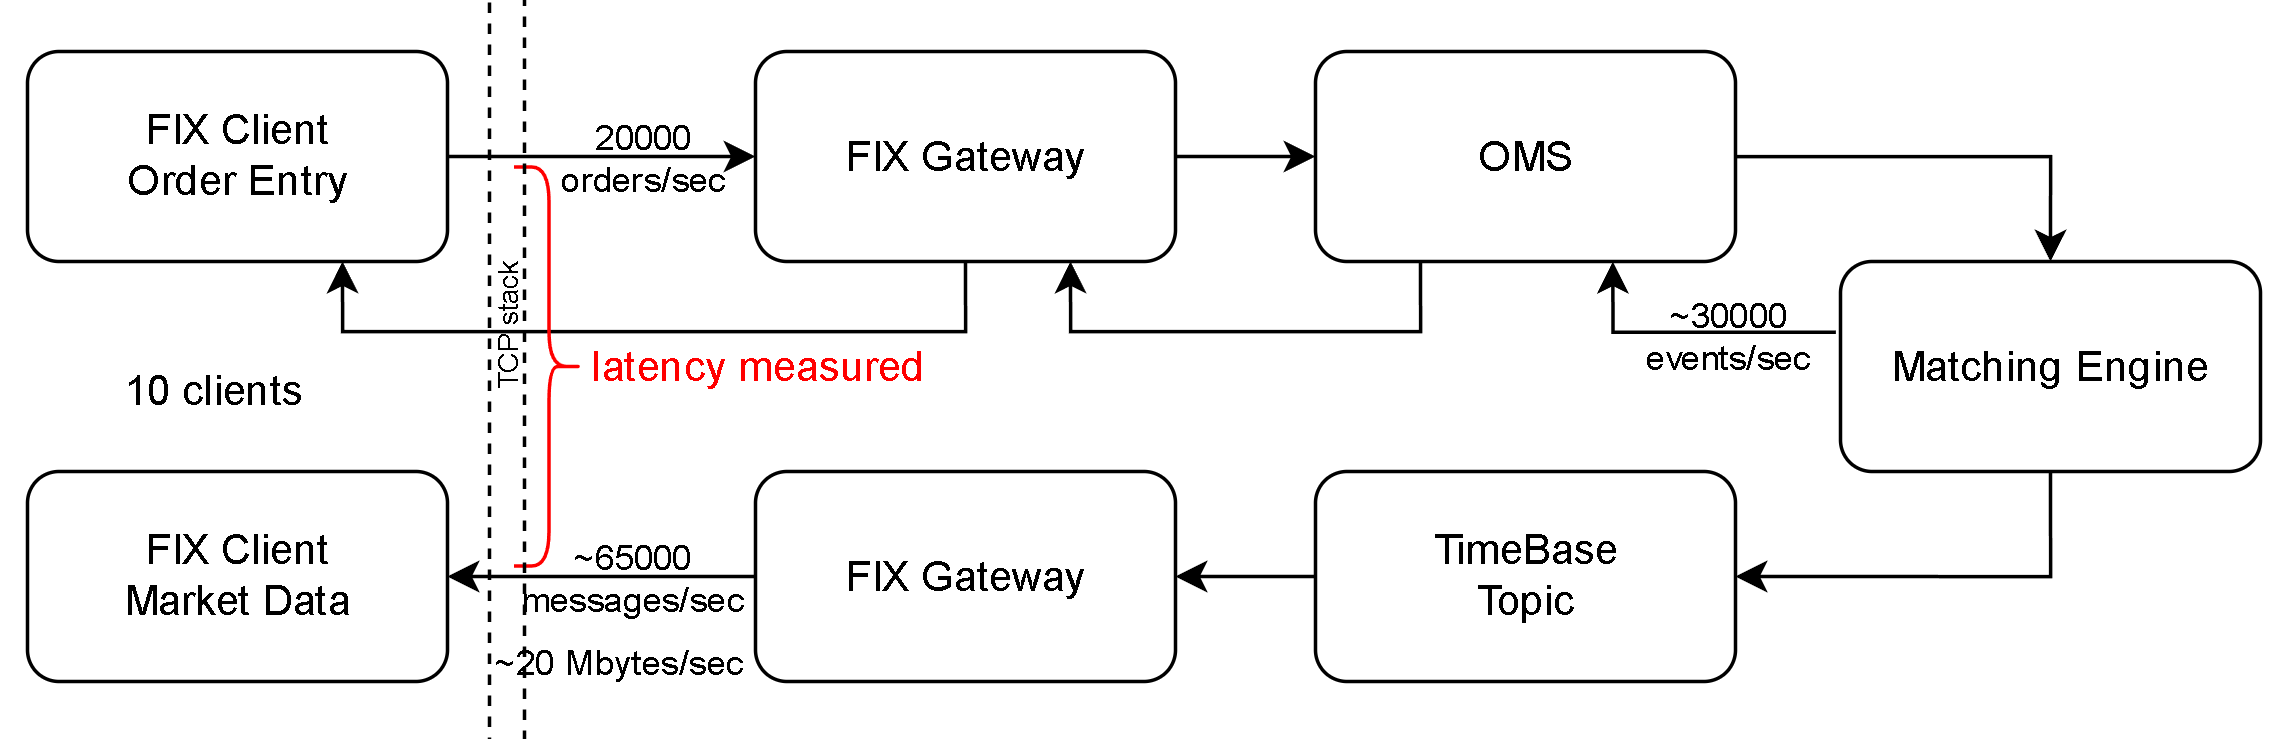
In this experiment model of market making exchange:
- 10 FIX clients sending combined rate 25000 order request per second to FIX order entry gateway
- Orders are routed to NIAGARA matching engine
- A realistic mix of MARKET and LIMIT orders results in certain percent of partial and complete fills, cancellations, and small number of rejections. Order prices use normal distribution where median price of BUY and SELL orders.
- Special care is taken to avoid growth of number of orders that are active in matching engine at any given point of time. Orders that remain active have maximum lifetime before client cancels them.
This model allows running FIX clients for many hours under sustained system load.
Configured test parameters:
- Order request rate = 20K order requests per second
- Order lifetime timeout = 60 seconds
Observed rates:
- Matching Engine produced around 30K of order events per second (combination of fill, cancel, and rejection events)
- around 6.5K/sec or market data update messages (incremental update messages possibly containing multiple data entries)
- market data distributed to 10 connected FIX clients resulted in around 65K per second of FIX market data update messages.
Environment
- Server: AWS c6id.12xlarge, Amazon Linux 2, docker-compose, Amazon Corretto 11 JVM
- Client: AWS c6i.4xlarge, Amazon Linux 2, Amazon Corretto 11 JVM
Method
Step 1: Capture inbound FIX order entry and outbound FIX market data traffic. For our experiment this was done using
sudo tcpdump -i eth0 "tcp portrange 12001-12010 or tcp portrange 10001-10010" -w capture.pcap
Step 2: Use "OTT" version of latency tool to analyze recorded traffic. The tool correlates outbound FIX market data messages (35=X, tag 278 identifies each quote) with order acknowledgement messages referring to the same quotes (35=8, correlated tag 37 is quote ID, tag 11 is order ID), and then with inbound order new single (35=D, correlated with 35=8 using tag 11) messages.
wget https://deltix-installers.s3.eu-west-3.amazonaws.com/LatencyTool/latency-tool-centos-linux-x64-1-0-16-4-ott.zip
unzip latency-tool-centos-linux-x64-1-0-16-4-ott.zip
./lt-ott
Comparison with order acknowledgement latency
Since this order-to-tick experiment used the same method as order acknowledgement latency (as described here) it may be appropriate to compare the two.
In both latency metrics initial moment of time is network packet containing FIX order entry request. In both metrics signal travels to matching engine using the same path.
However, in case of the order-ack-metric - order acknowledgement event travels back using reverse path, in order-to-tick experiment described here market data are sent to TimeBase Topic rebroadcasted by FIX market data gateway. Each market data message is then broadcasted to 10 subscribers.
This table shows results of both latency tests taken on AWS from the same setup:
| metric | order-ack | order-to-tick |
|---|---|---|
| 50% | 18 us | 42 us |
| 90% | 32 us | 67 us |
| 99% | 40 us | 91 us |
Identified bottlenecks
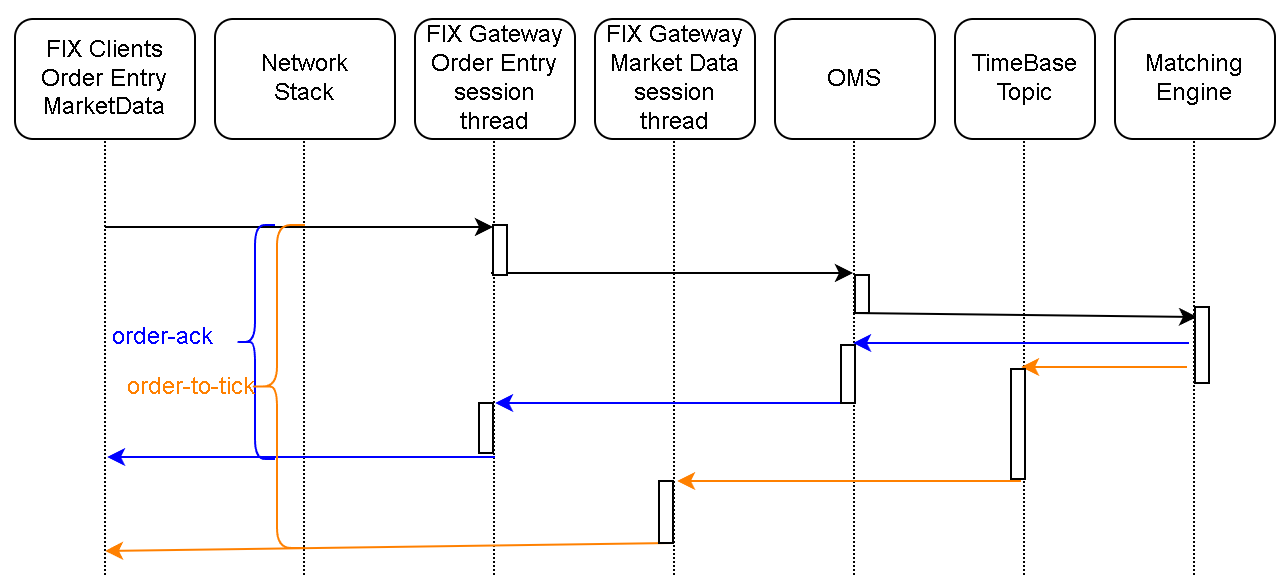
Here is another diagram shows signal path for order-to-acknowledgement (blue) and order-to-tick (orange):
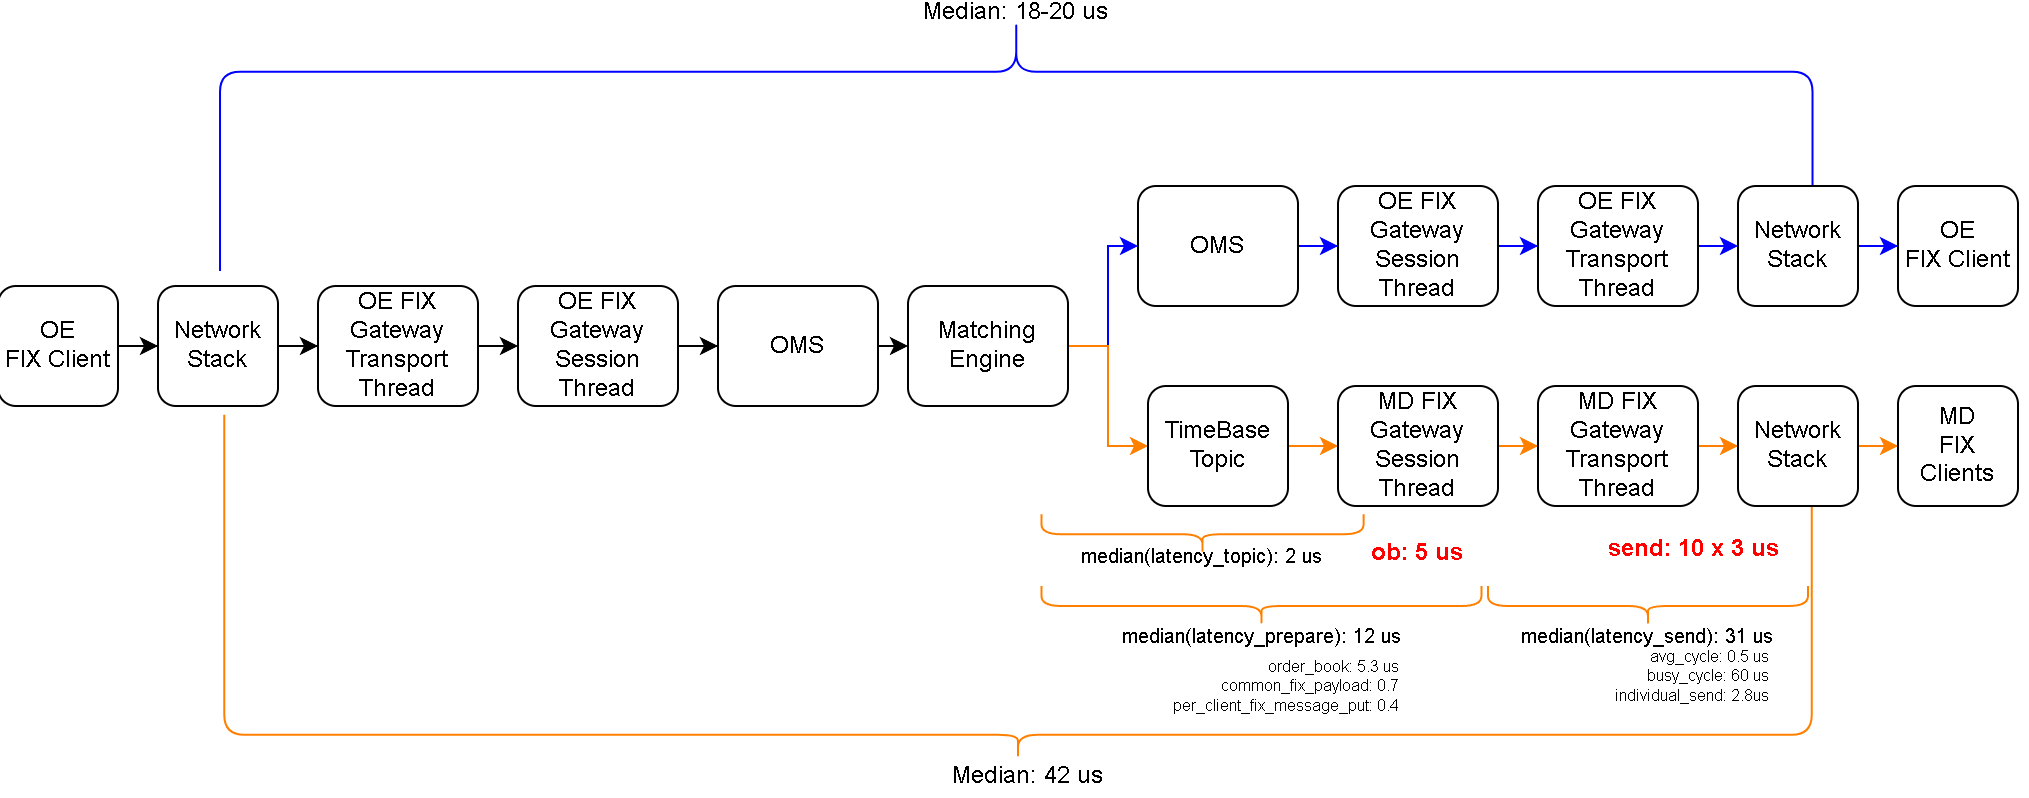
We instrumented FIX Market Data gateway with tracing clocks and analyzed timestamps available at intermediate points. This identified two main bottlenecks:
Level3 Order Book processor - QuoteFlow Order Book processor employed to maintain order book state in FIX Market Data Gateway takes about 5 microsecond per market message. November 2023 Update: Implemented new L3 Order Book library that reduces median processing time from about 5 to 1 microseconds.
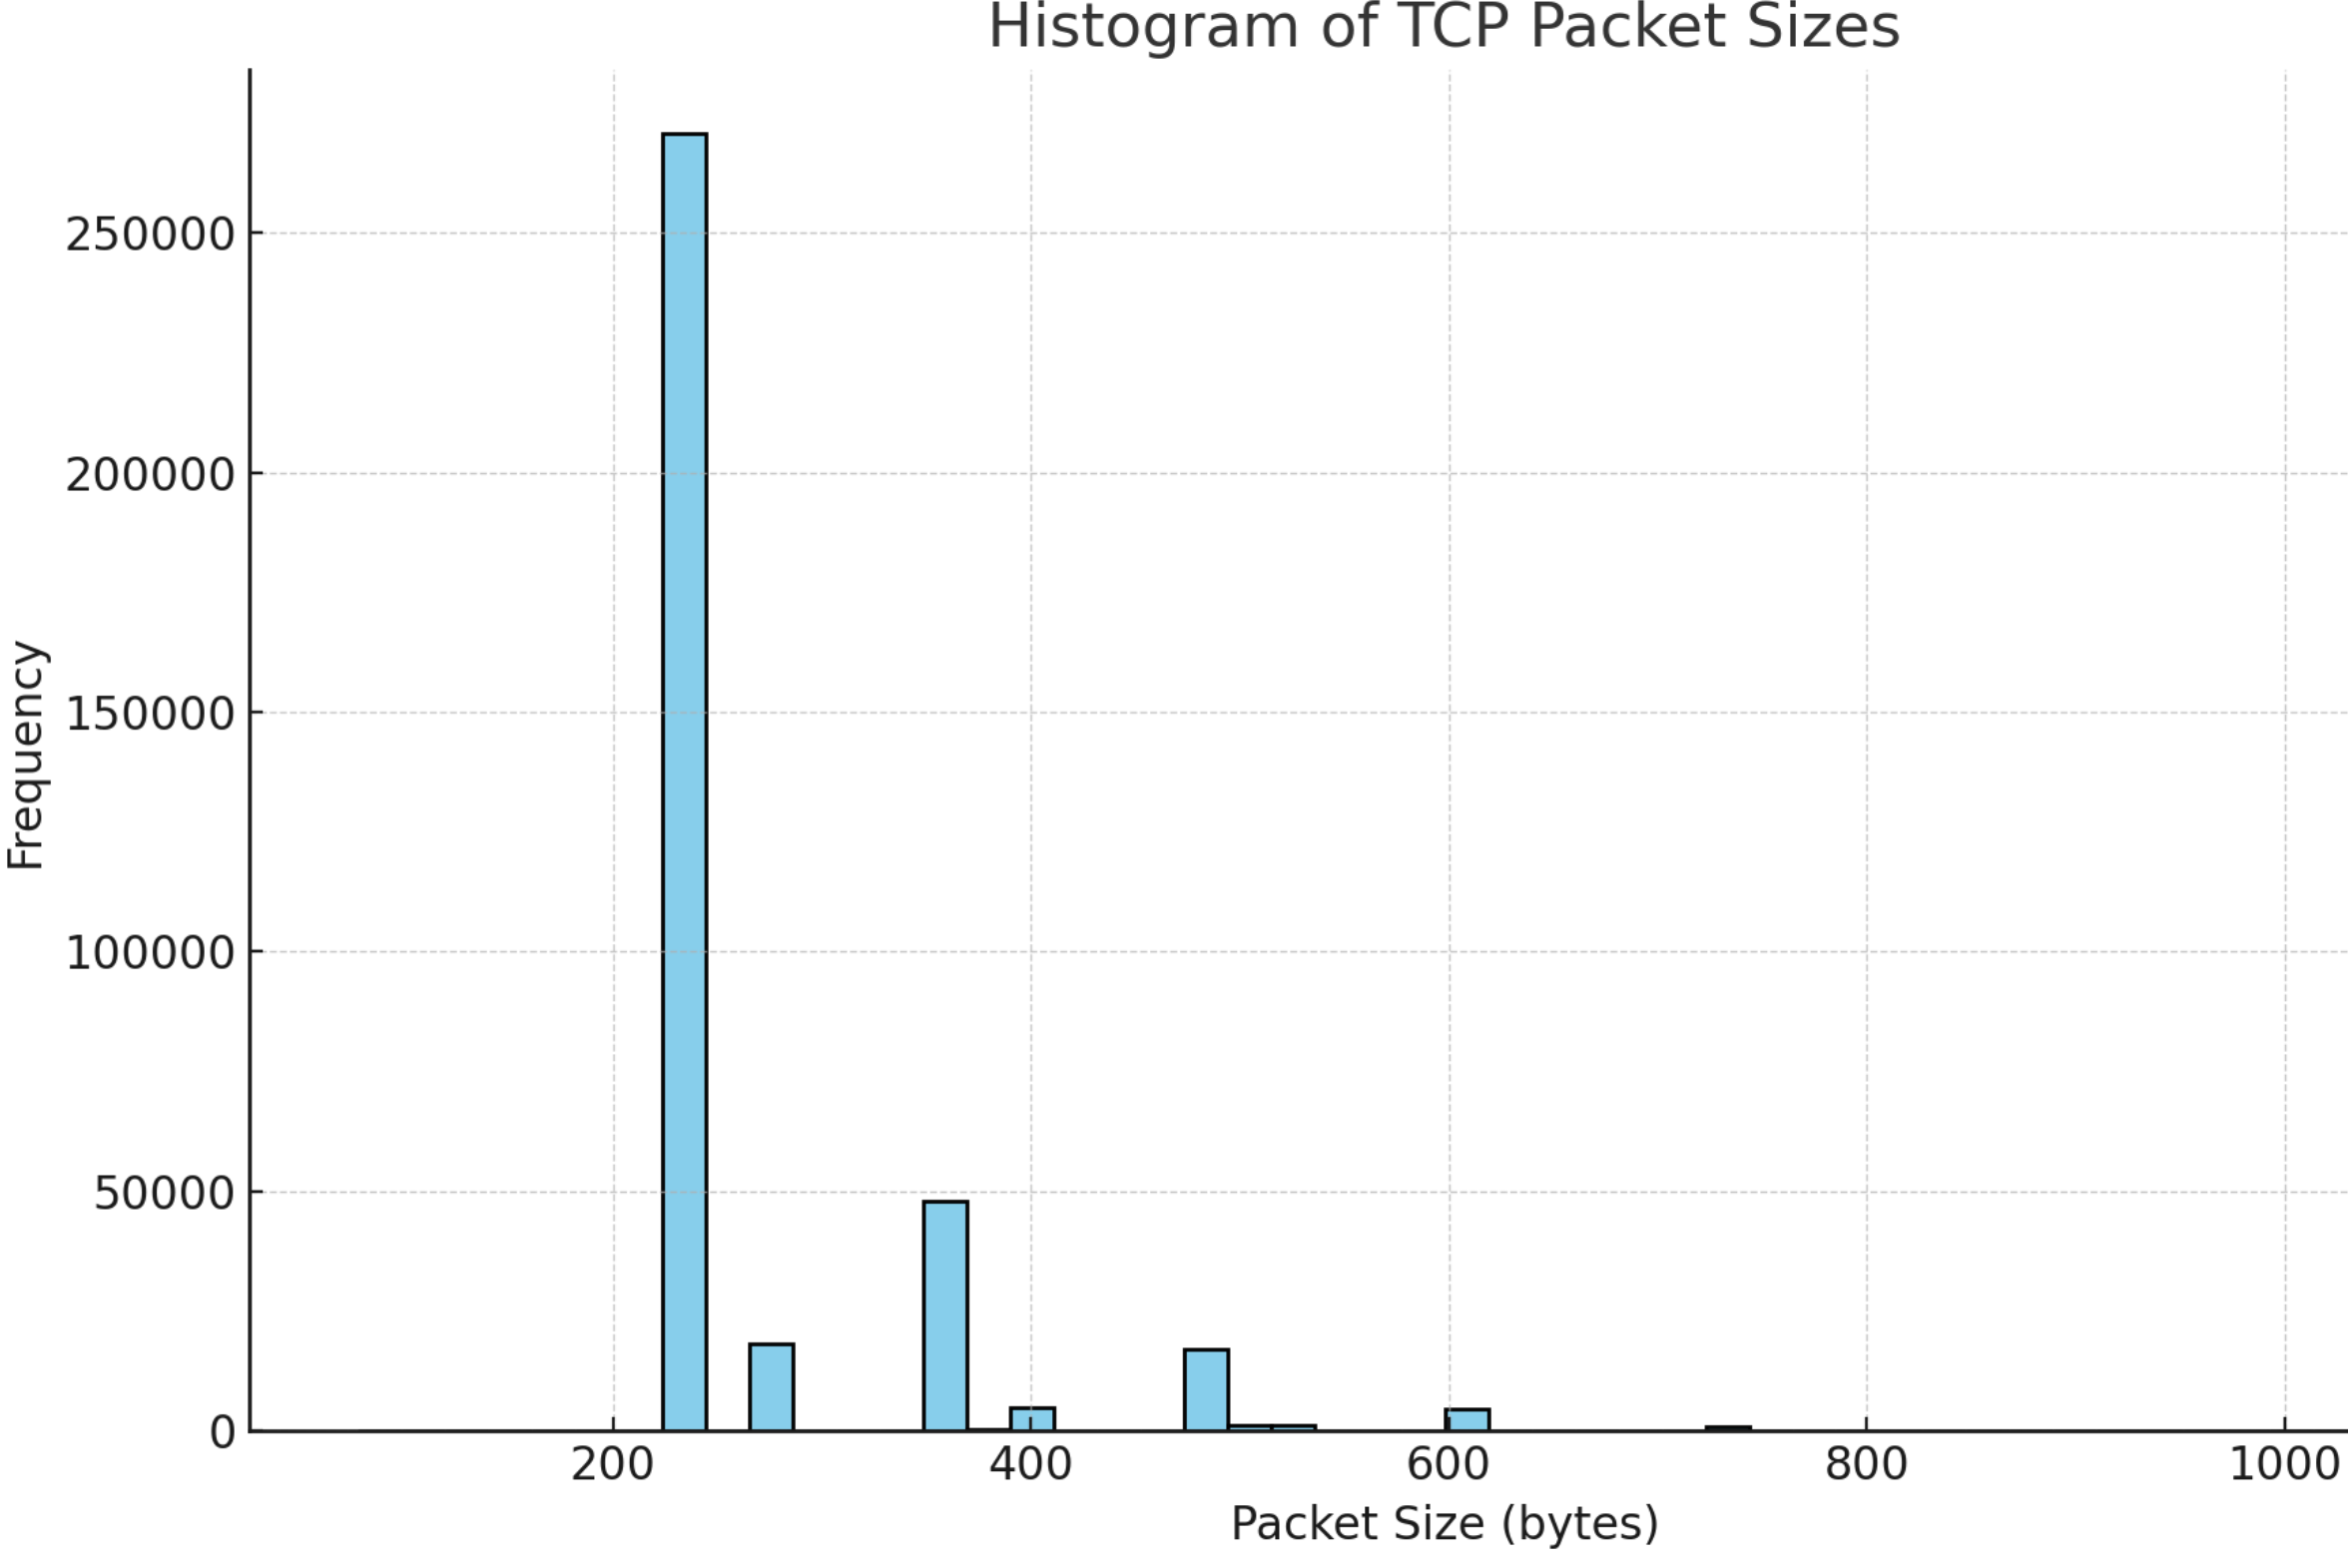
Sequential calls to non-blocking Socket send API in Java NIO. In this experiment with typical payload size of around 240 bytes, cost of doing non-blocking socket send was about 2.5 microseconds per call. When we distribute each signals to all ten connected clients sequentially this cost accumulate.
*November 2023 Update: Switching to TCP bypass solution Xilinx ONLOAD reduced this time from 2.3 to 0.78 microseconds.
Market message rates and cost of send
Session thread of Deltix Market Data gateway spends about 0.4 microseconds preparing individual FIX Market Data Update (35=X) message for each connected FIX client (counting time to enqueue message to Transport thread). While body of the message is reused between all connected clients, each message still has individual header and footer that reflects differences in FIX Comp IDs and sequence numbers, as well as overall length, sending time, and message check sum.
As result FIX messages come to transport thread in bursts:
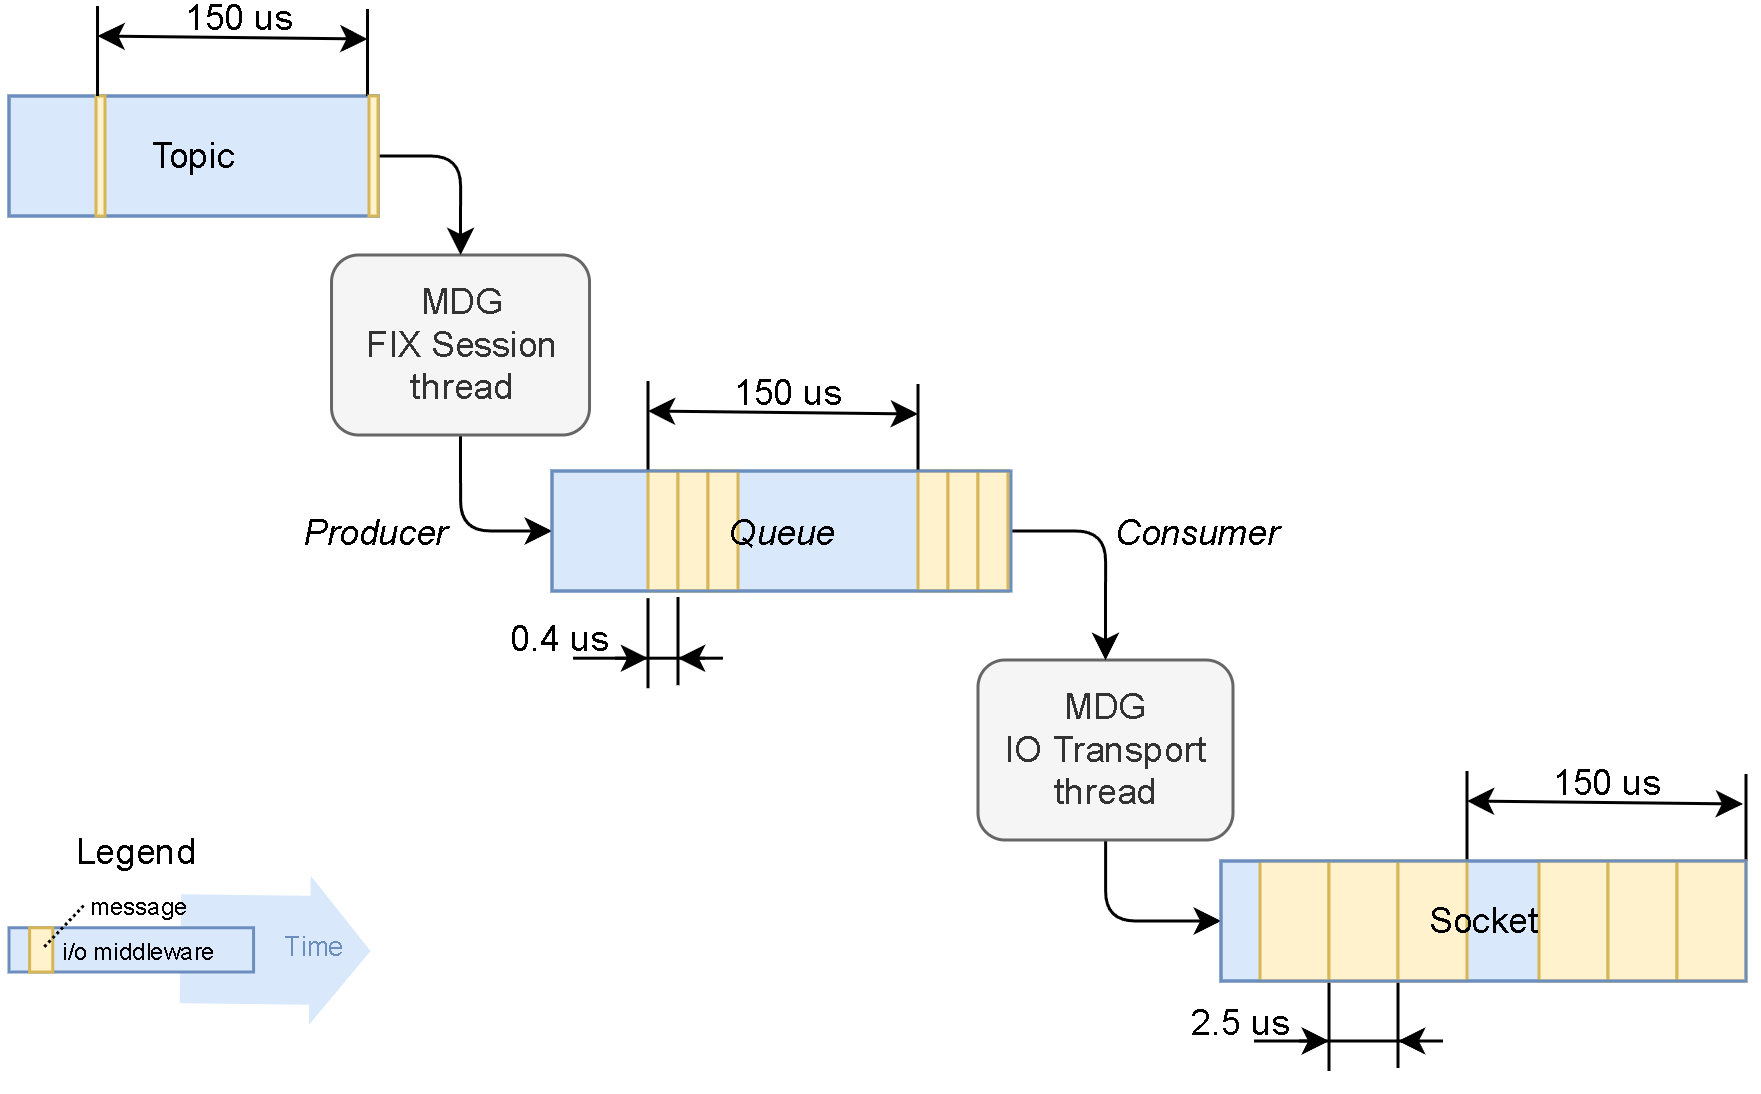 At the same time transport thread spends about 2.5 microseconds on average performing non-blocking socket send for each FIX message. As result, after idle periods transport thread usually discovers batches of 10 messages to send to each individual client socket.
Xilinx Onload effect
Before
01:25:43 - INDIVIDUAL_SEND
  Percentile (%)     Value (ns)          Count      Count Sum
           0.000            594              1              1
          10.000           2511         444393         444394
          20.000           2607         448391         892785
          30.000           2673         448595        1341380
          40.000           2725         439567        1780947
          50.000           2773         440579        2221526
          60.000           2823         444944        2666470
          80.000           2955         891379        3557849
          90.000           3073         441066        3998915
          99.000           4065         396632        4395547
          99.900           5415          39735        4435282
          99.990           7223           3997        4439279
          99.999          10319            397        4439676
         100.000          26735             44        4439720
  [Min 594 ns, Mean 2796 ns, Max 26735 ns, Total 4439720]
After
14:27:30 - INDIVIDUAL_SEND
    Percentile (%)     Value (ns)          Count      Count Sum
             0.000            254              1              1
            10.000            650         424311         424312
            20.000            677         413387         837699
            30.000            701         409609        1247308
            40.000            734         421855        1669163
            50.000            781         409242        2078405
            60.000            817         422744        2501149
            70.000            845         413609        2914758
            80.000            872         415617        3330375
            90.000            911         411055        3741430
            99.000           1284         370936        4112366
            99.900           1996          37318        4149684
            99.990           2543           3736        4153420
            99.999           3285            369        4153789
           100.000           8855             41        4153830
    [Min 254 ns, Mean 788 ns, Max 8855 ns, Total 4153830]
To be continued...