WebSocket Data Feed Latency
Author: Barys Chuprin
Overview
When using Deltix tools and working with market data, latency can occur due to the speed at which the data enters the system. We conducted an experiment to investigate this possibility with regards to data coming from the Binance exchange.
This document presents our experiment in measuring network latency in a WebSocket-based Binance market data feed. We gathered statistics by intercepting network packets and comparing their as-captured timestamps with the exchange's as-emitted timestamps.
For as-captured timestamps, given that we use the Linux LIBPCAP library to capture market data traffic we used a packet receive time set by Linux kernel. Assuming that both our system and the exchange synchronized local clocks with a reliable source, this method enabled us to gather valuable statistics about market data latency.
The following sections discuss our approach and results:
The following sections provide guidance on reproducing our experiment:
Linux utilities traceroute and mrt provide quick insight into network latency to exchange server. We suggest you try them first. When network hops nearest to you look good method described here can be used to analyze lag of internal exchange network.
Setup
You don't have to use the same setup to follow our steps, however, we want to document what was used by us for your reference.
Environment
We used the following environment components:
- AWS Instance: An AWS c5.2xlarge instance running in the apne1-az1 zone, situated in the Tokyo region.
- Operating System: Amazon Linux 2.
A visual representation of the environment setup:
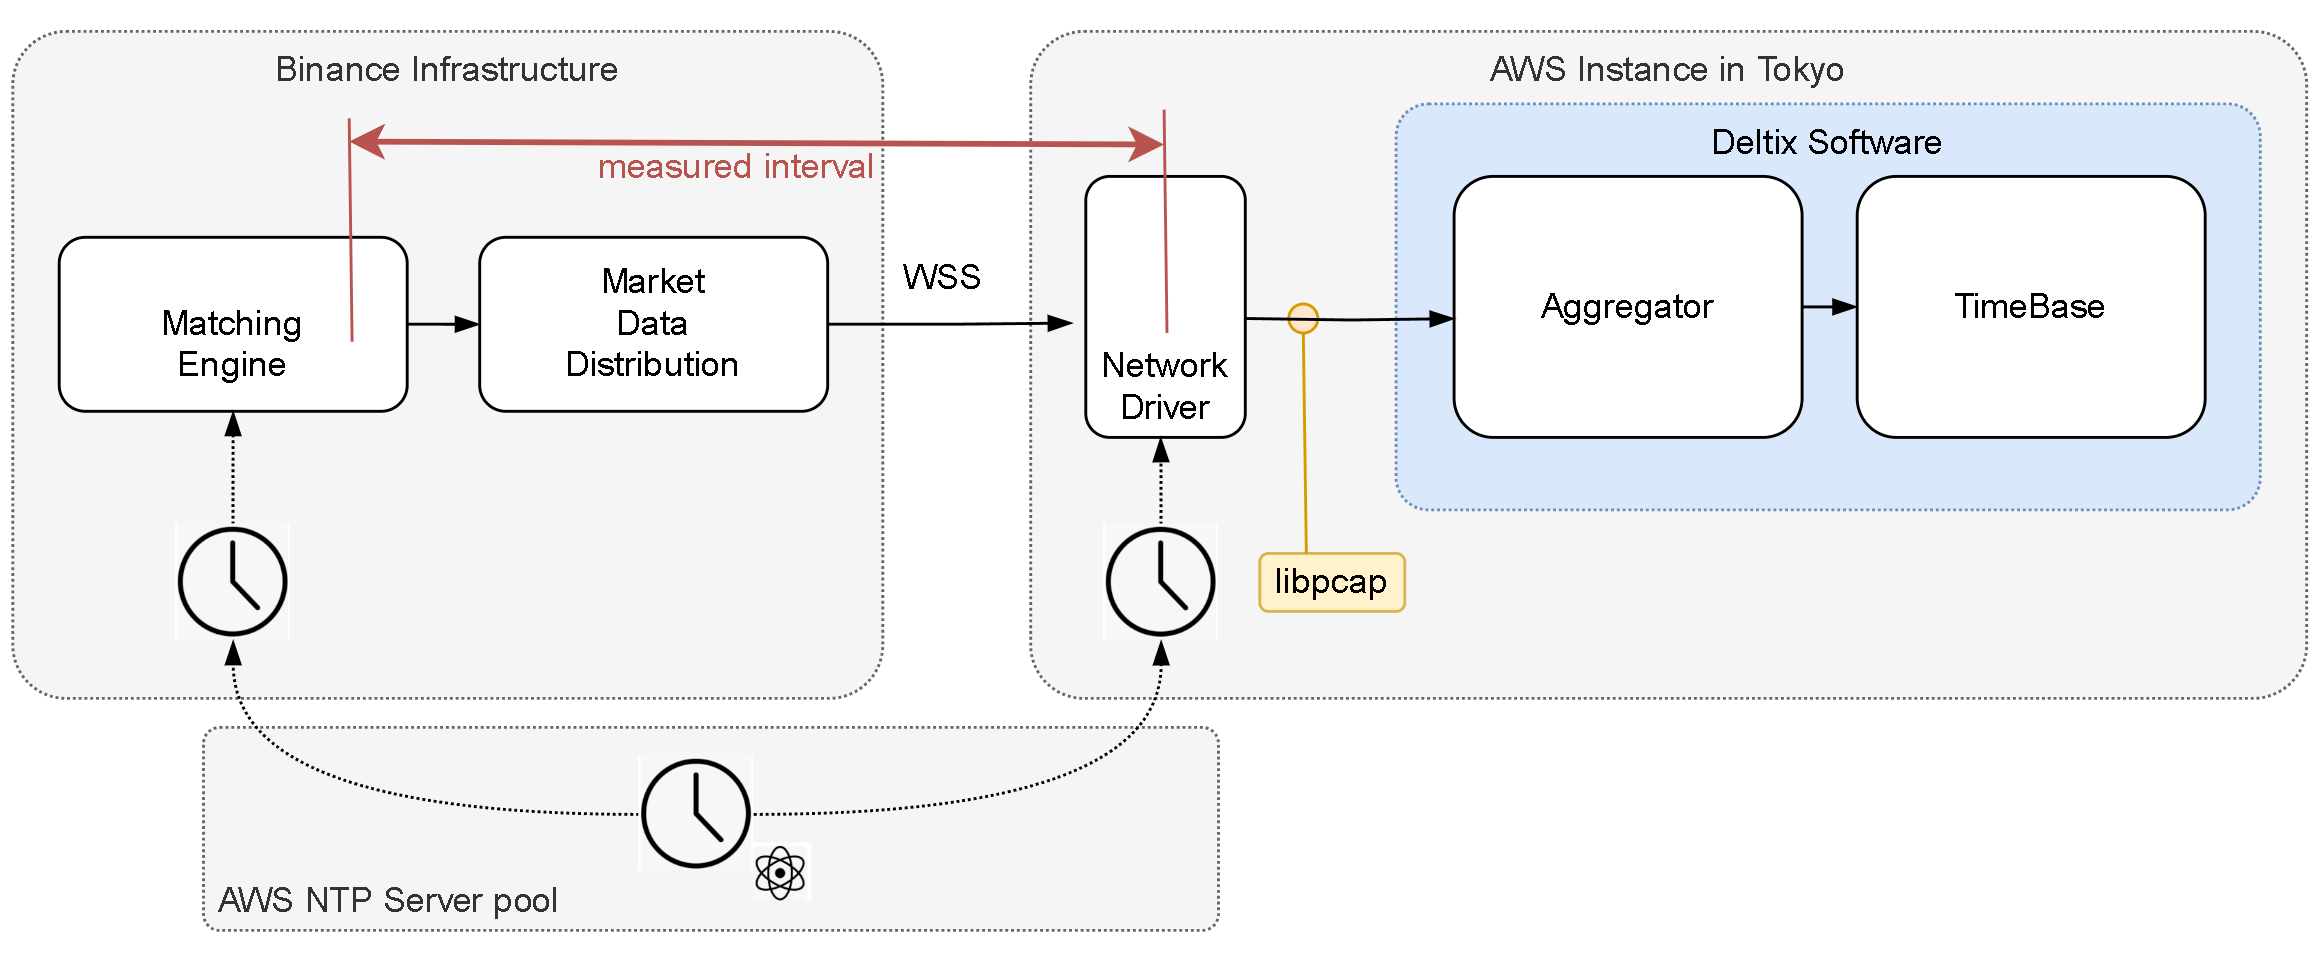
Clock Synchronization
To ensure accurate timekeeping, we configured a Chrony service.
The Chrony service synchronized with the AWS NTP service at the IP address 169.254.169.123 every 2 seconds. The clock error bound was approximately 0.3 milliseconds:
chronyc sources -v

  .-- Source mode  '^' = server, '=' = peer, '#' = local clock.
 / .- Source state '*' = current best, '+' = combined, '-' = not combined,
| /             'x' = may be in error, '~' = too variable, '?' = unusable.
||                                                 .- xxxx [ yyyy ] +/- zzzz
||      Reachability register (octal) -.           |  xxxx = adjusted offset,
||      Log2(Polling interval) --.      |          |  yyyy = measured offset,
||                                \     |          |  zzzz = estimated error.
||                                 |    |           \
MS Name/IP address         Stratum Poll Reach LastRx Last sample
===============================================================================
^* 169.254.169.123               3   1   377     2  -5688ns[-7702ns] +/-  396us
To see similar output, use the chronyc sources -v command.
Tuned Profile
To optimize the server's performance, we used a latency performance tuned profile.
TLS Decryption
Binance's WebSocket market data traffic is encrypted using TLS. To decrypt network packets that we intercepted, we used a jSSLKeyLog agent.
You can also use alternative implementations like this library which we also tested.
Method
There are two possible approaches to analyzing network traffic latency numbers. We follow and recommend the offline analysis method since it is easier to reproduce.
Offline Analysis
Traffic is first recorded into a pcap file with a tool like tcpdump or Wireshark/tshark, and later analyzed with a combination of tshark, the tshark-ws-parser WebSocket data parser utility, and latency-tool, usually on another system. Using tcpdump has a minimal performance cost, unless the disk i/o affects jitter.
To minimize file size, you can apply a filter to record only a single connection, rather than having all data pass through the network interface.
Online Analysis
tshark, the tshark-ws-parser WebSocket data parser utility, and latency-tool run and output results in real-time on the target system. This incurs a small but noticeable performance cost and consumes several processes/threads, but does not require saving data traffic into a file and avoids disk I/O.
This approach is currently considered experimental and not mentioned further in this document.
Deltix Tools
Here are links to the aforementioned Deltix tools:
- WebSocket Parser helper utility
tshark-ws-parser: CentOS/AmazonLinux2 and Alpine. - Latency analysis tool
latency-tool: CentOS/AmazonLinux2 and Alpine.
Results
AWS Tokyo Region
We observed that the Binance market data in the Tokyo AWS region came to us with an average latency of 4 milliseconds. 99 percent of messages arrived in under 13 milliseconds.
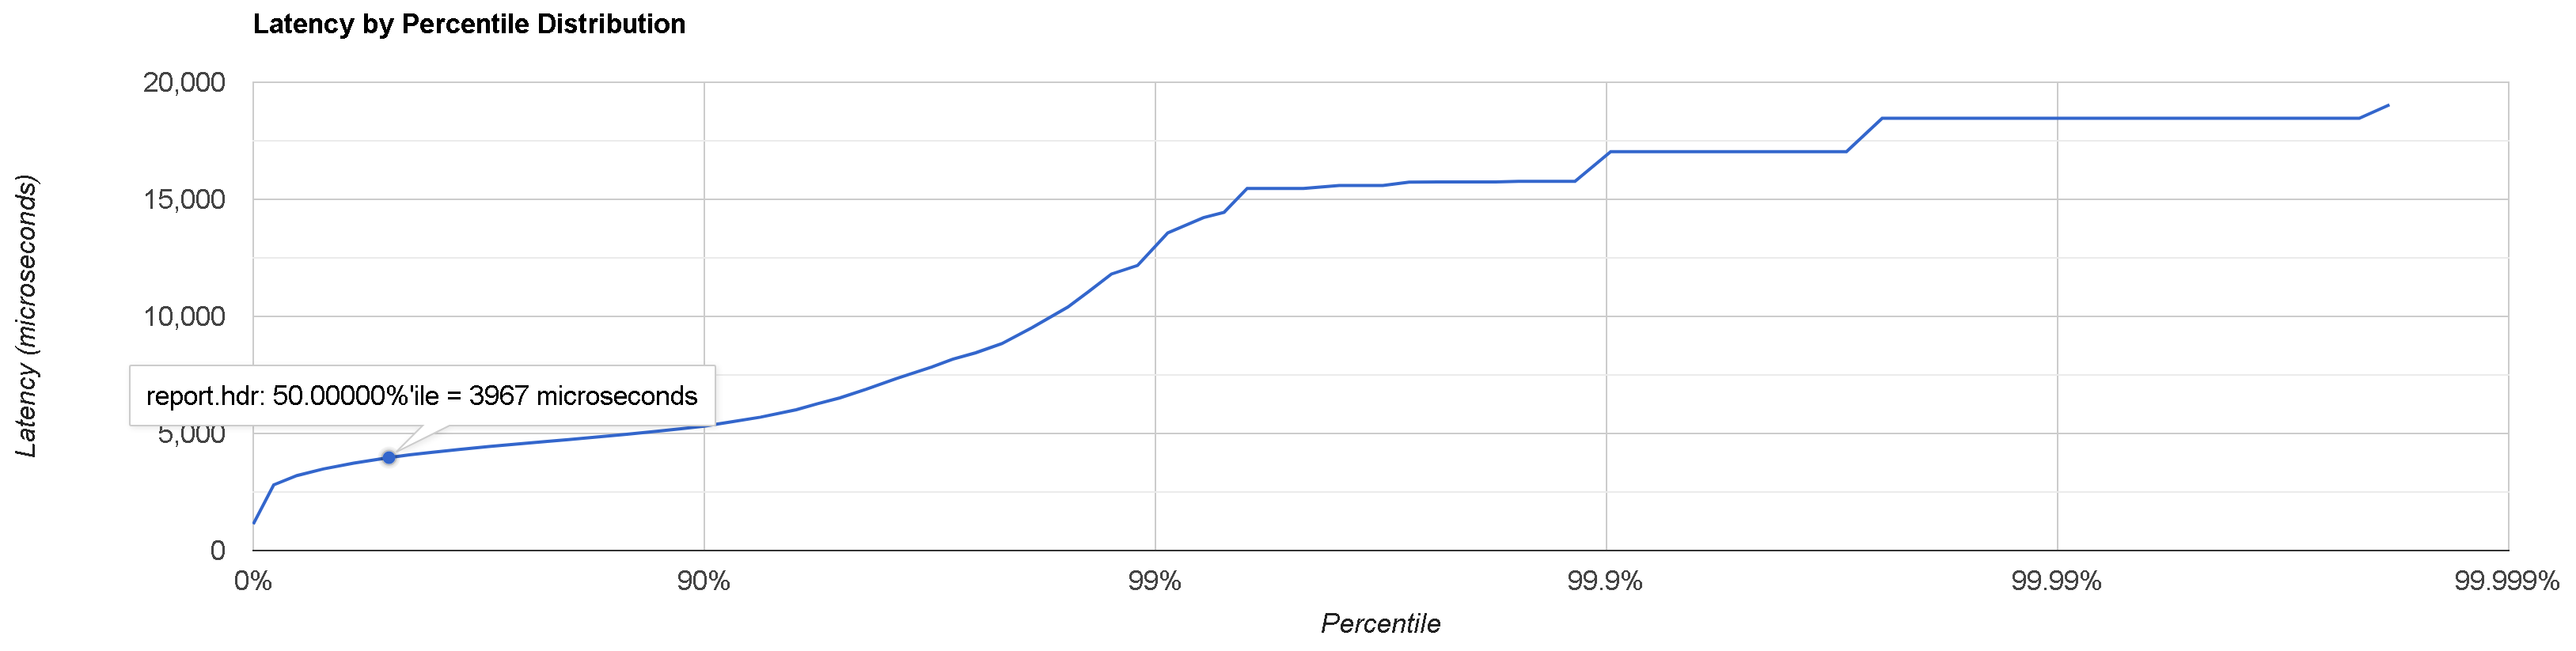
June 8th
Here are the results for the BTC/USDT feed latency measured on June 8th, 2023, between 15:00 and 16:00 (UTC-4):
--------   Latency IN -> OUT   --------
Percentile : Microseconds : Event count
MIN        :       1125.0 :           1
50.0%      :       3967.0 :       25042
90.0%      :       5315.0 :       45052
99.0%      :      13097.0 :       49574
99.9%      :      15925.0 :       50004
99.99%     :      18459.0 :       50053
99.999%    :      18459.0 :       50053
99.9999%   :      19037.0 :       50054
99.99999%  :      19037.0 :       50054
99.999999% :      19037.0 :       50054
MAX, TOTAL :      19037.0 :       50054
The corresponding histogram report:
June 9th
Here are the results measured on June 9th:
--------   Latency IN -> OUT   --------
Percentile : Microseconds : Event count
MIN        :       1180.0 :           1
50.0%      :       3942.0 :       39532
90.0%      :       5585.0 :       71125
99.0%      :      11523.0 :       78238
99.9%      :      24362.0 :       78951
99.99%     :      26446.0 :       79025
99.999%    :      26446.0 :       79025
99.9999%   :      26446.0 :       79025
99.99999%  :      26446.0 :       79025
99.999999% :      26446.0 :       79025
MAX, TOTAL :      26446.0 :       79025
Additional Tokyo Availability Zones
We ran this experiment in three different AWS Availability Zones (AZs) in the Tokyo region. The recordings of the Binance WebSocket feed were done at roughly the same time. The results show that all three AZs received data with a similar average latency, with differences falling within the error margin.
apne1-az1
--------   Latency IN -> OUT   --------
Percentile : Microseconds : Event count
MIN        :       1519.0 :           1
50.0%      :       3768.0 :         932
90.0%      :       6282.0 :        1679
99.0%      :      34413.0 :        1845
99.9%      :      50915.0 :        1862
99.99%     :      52348.0 :        1864
99.999%    :      52348.0 :        1864
99.9999%   :      52348.0 :        1864
99.99999%  :      52348.0 :        1864
99.999999% :      52348.0 :        1864
MAX, TOTAL :      52348.0 :        1864
apne1-az2
--------   Latency IN -> OUT   --------
Percentile : Microseconds : Event count
MIN        :       2064.0 :           1
50.0%      :       4568.0 :         935
90.0%      :       9687.0 :        1683
99.0%      :      39359.0 :        1850
99.9%      :      52071.0 :        1867
99.99%     :      54881.0 :        1869
99.999%    :      54881.0 :        1869
99.9999%   :      54881.0 :        1869
99.99999%  :      54881.0 :        1869
99.999999% :      54881.0 :        1869
MAX, TOTAL :      54881.0 :        1869
apne1-az3
No compatible instance types were available.
apne1-az4
--------   Latency IN -> OUT   --------
Percentile : Microseconds : Event count
MIN        :       1895.0 :           1
50.0%      :       4144.0 :         957
90.0%      :       6796.0 :        1722
99.0%      :      36575.0 :        1894
99.9%      :      51448.0 :        1911
99.99%     :      53130.0 :        1913
99.999%    :      53130.0 :        1913
99.9999%   :      53130.0 :        1913
99.99999%  :      53130.0 :        1913
99.999999% :      53130.0 :        1913
MAX, TOTAL :      53130.0 :        1913
Reproducing the Experiment
This section outlines the steps you need to measure Binance market data latency in your own environment.
Prerequisites
Before beginning this procedure, make sure you have a market data connector for the Binance exchange already configured.
The Binance WebSocket endpoint is available at: wss://data-stream.binance.vision:9443.
For more information on this endpoint, refer to the Binance WebSocket API documentation.
Step 1: Start Recording Packet Capture
To intercept traffic coming from port 9443, and given that eth0 is called on the network interface, use the following command:
sudo tcpdump -i eth0 tcp port 9443 -w capture.pcap
The tcp port 9443 capture filter described in the tcpdump manual captures the relevant traffic. On your first attempt, you can omit -w capture.pcap to check for incoming data without saving it to a file.
Step 2: Restart Connector
After starting the recording session:
- Add the following process parameter to the Deltix Aggregator tool:
AGGSERVER_OPTS=-javaagent:/sslkeylog/jSSLKeyLog.jar==/sslkeylog/sslkey.log. Here we use jSSLKeylog agent library we described above. - Restart your Binance connector.
Failing to restart the connectors after starting the recording can lead to issues decrypting the recorded data. See the Troubleshooting section.
Step 3: Analyze Recorded Packet Data
To decrypt TLS traffic, use the tshark tool.
Follow these steps:
- Install
tsharkon Linux using a package manager or build it from source if the package version is too old.Note that
tsharkversions prior to 2.0 lack WebSocket protocol support. Amazon Linux 2 provides version 1.10. You can runtsharkin a container as a workaround. - Ensure you have
capture.pcapandsslkey.login the current directory, and the latency analysis binaries are in the./binsubdirectory. - Run the following command:
tshark \
  -r capture.pcap \
  -o tls.keylog_file:/home/ec2-user/sslkeylog/sslkey.log \
  -Y "websocket.payload" \
  -o gui.column.format:"Time","%t" \
  -t e \
  -P \
  -x \
  -l  \
| ~/latency-tool/tshark-ws-parser \
| ~/latency-tool/latency-tool -d
Alternatively, you can run tshark in a container using the following command:
docker run \
  --rm \
  -v $(pwd)/capture.pcap:/data/capture.pcap \
  -v /home/ec2-user/sslkeylog/sslkey.log:/sslkeylog/sslkey.log \
  cincan/tshark \
  -r /data/capture.pcap \
  -o tls.keylog_file:/sslkeylog/sslkey.log \
  -Y "websocket.payload" \
  -o gui.column.format:"Time","%t" \
  -t e \
  -P \
  -x \
  -l  \
| ~/latency-tool/tshark-ws-parser \
| ~/latency-tool/latency-tool -d
Generate an HDR Histogram Report
This step is optional.
To generate an HDR Histogram report, use the parameter --hdr=report.hdr.
You can find an HDR Histogram plotter on Gil Tene's site.
If you're having trouble printing the histogram report, refer to the troubleshooting section.
Troubleshooting
Is my WebSocket Data Viable?
Check for WebSocket Text
To verify that you have captured useful WebSocket data, follow these steps:
Make sure you have the capture.pcap and sslkey.log files in your current directory.
Run the following command:
tshark -r capture.pcap -o tls.keylog_file:sslkey.log -Y websocket.payload
If you can see the phrase WebSocket text, it indicates that your captured data is viable. Your data can be analyzed as long as it comes from a supported provider.
If you cannot see the phrase WebSocket text, continue to the next secion.
To further confirm, use the following command to display readable payload text (assuming WS port == 9443):
tshark \
  -r capture.pcap \
  -o tls.keylog_file:sslkey.log \
  -Y "tcp.port == 9443 && websocket.payload" \
  -T fields \
  -e frame.time_epoch \
  -e text
Can't See WebSocket text
If you tried the steps in the previous section and are still unable to see the phrase WebSocket text, it means that the data you've obtained cannot be decrypted.
If this is the case, try the following command:
tshark -r capture.pcap -Y tls
If you can now see lines containing TLS and application data but still don't see the WebSocket text phrase, it means that tshark was unable to decrypt the TLS stream(s).
Possible causes:
- Using an incorrect path to the sslkey.log file, the file being absent or empty. Note that
tsharkdoes not report an error if it was unable to find or open this file. - The sslkey.log file does not contain proper keys, possibly because the
pcaprecording did not start before the connection was established. Open the file and check the timestamps. Ensure you starttcpdumpbefore the client connects to the WebSocket feed.
If you still can't see any output from tshark, it is likely you did not record any useful data to the pcap file due to an incorrect port/IP filter or the wrong network interface selected in your tcpdump command line. Check the size of the pcap file. Try opening it in Wireshark, and verify that your tcpdump command line is correct.
Histogram Report Not Generating
If you successfully obtained the WebSocket payload text but not the latency histogram report, try omitting | bin/latency-tool -d from the command line.
The normal output of tshark-ws-parser looks like this:
1670944829409000000 1670944840985197000
1670944840441000000 1670944840985197000
1670944831356000000 1670944841051799000
...
If you do not see this output, possible causes include:
- The data feed format is not supported.
- The format wasn't autodetected correctly.
- There is currently no usable data and the feed is idling.
Contact Us
Questions? Please reach out to the Deltix support team: support@deltixlab.com. We are happy to help you measure latency in your specific conditions.