Matching Engine Order Throughput
December 2025
Overview
In this experiment we analyze Ember throughput. More specifically we will measure maximum sustained rate of order requests before system will exhibits signs of overload and identify current bottleneck.
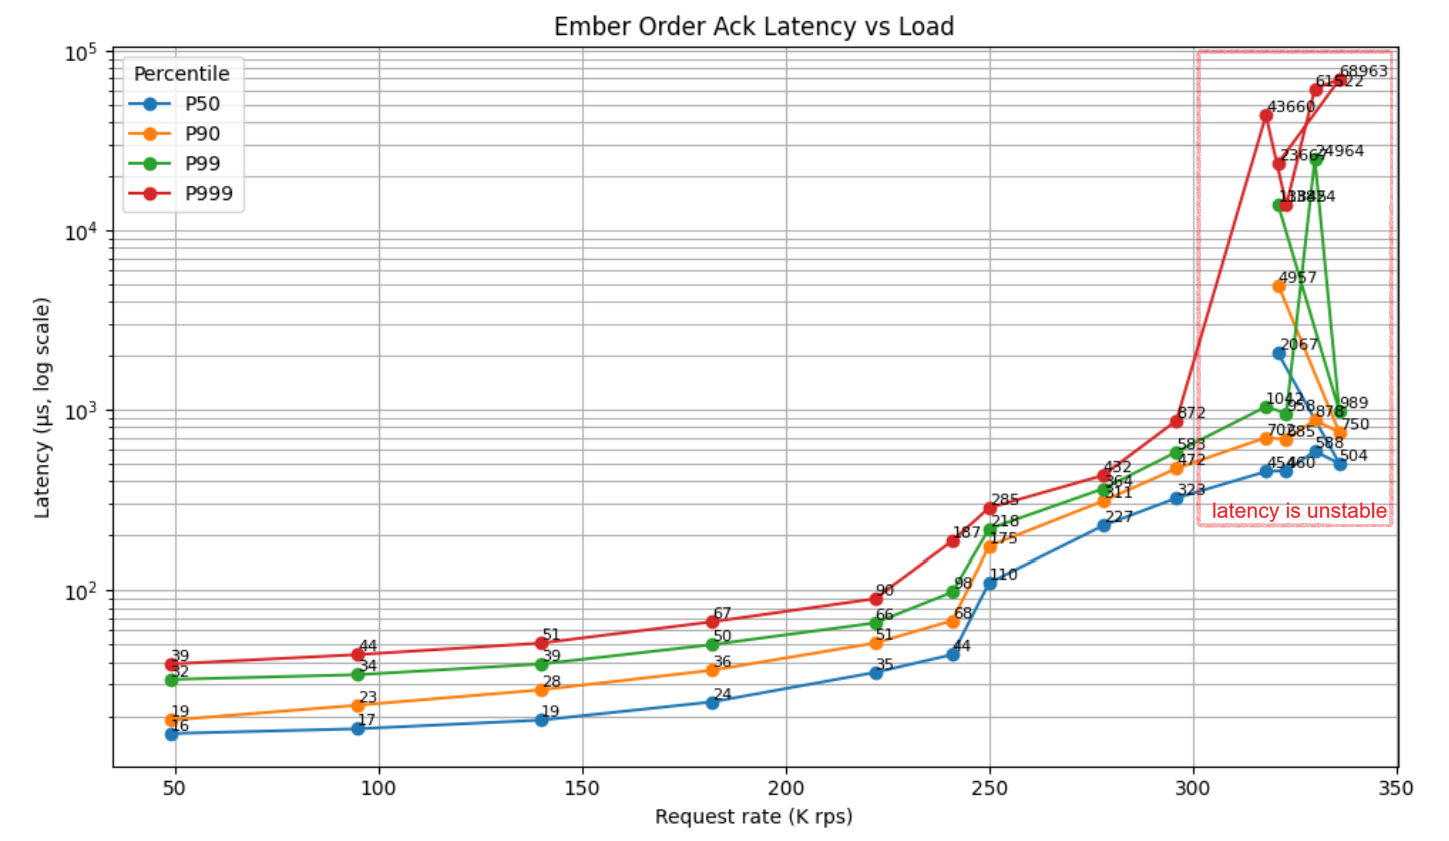
Result summary: in matching engine scenarios single Ember OEMS instance experiences high load at around 400-450K order messages per second of sustained load. Ember overload protection steps in at around 625K requests per second of sustained load.
Experiment design
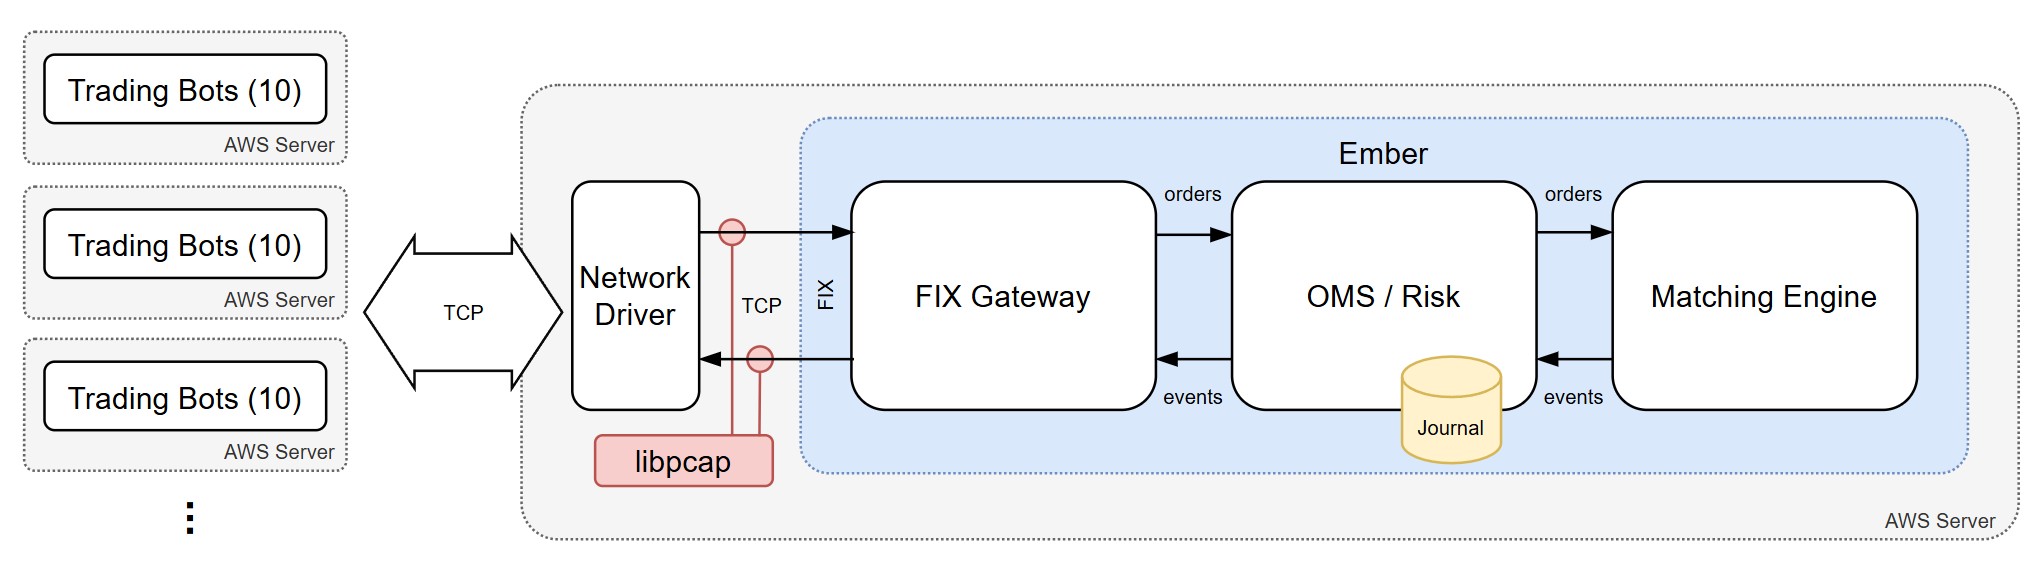
In this experiment, we repurpose our Ember latency test framework, which auto-provisions Linux servers on AWS. The main server hosts Ember with the FIX gateway and matching engine, while additional servers run bots simulating FIX clients that send order requests.
 By gradually increasing the number of client servers, we drive higher order rates. The framework then measures order acknowledgement latency at each request rate.
In this realistic test, order requests are simulated by N bots. Each bot submits a mix of BUY and SELL orders, consisting of MARKET and LIMIT types, with prices drawn from a normal distribution to ensure a natural balance of aggressive and passive orders. As a result, the system produces a realistic combination of ACKs, FILLS, and REJECTS.
During this test, we perform a series of runs, each consisting of a warm-up phase followed by a 10-minute measurement period during which latency data is collected. For subsequent runs, either bot rate or the number of bots (N) is increased from 10 to 20, 30, and 40, resulting in a higher overall request rate. Full order request load is split between multiple parallel bots and between multiple client servers to avoid any suspicion that client side could be a bottleneck.
Latency is measured using the LIBPCAP method, which captures packets directly at the network interface, as described in the Matching Engine Latency Test article.
It represents the packet-to-packet time difference between the inbound network packet containing a FIX order request (35=D or 35=F) and the outbound packet containing the corresponding order acknowledgment (typically 35=8).
Environment
- AWS Cloud
- Ember running on c5d.12xlarge (with Intel Xeon Platinum 8275CL CPU @ 3.00GHz)
- Tuned version of Amazon Linux AMI
- OpenJDK 17.0.12 (Amazon Corretto)
- Ember 1.15.2 running under docker-compose
- Ember JVM options:
  -Xmx8G
  -Xms8G
  -XX:-TieredCompilation
  -XX:+UnlockDiagnosticVMOptions
  -XX:+UseSerialGC
  -XX:AutoBoxCacheMax=10000
  -XX:GuaranteedSafepointInterval=0
  -Ddeltix.disable.bounds.check=true
  -Dlatency.test=false
  -Daeron.socket.so_sndbuf=2m
  -Daeron.socket.so_rcvbuf=2m
  -Dagrona.disable.bounds.checks=true
Automated test framework: latency_new. Overrides appied during the test:
defaults/main.yml:
ember_client_connections: 10 #how many connections to server from each client (make sure ember.conf configures enough free FIX sessions)

ember_client_trade_extra_args: -rate 5000 -threads 4 -affinity 4,5 -activeOrdersWindow 2000 # Assuming we run with kernel ISOLCPU: 4-7,12-15
variables.tf:
variable "instance_count" {
  type = map(number)
  default = {
    "ember_server" = 1
    "ember_client" = 5
    "metrics"      = 0
  }
}
.env: NM Matching engine was used as test target.
export TESTING_ALGO=nm
export TESTING_EMBER_TAG=666.666.668-profiler
Results
| Load (K rps) | P50 (µs) | P90 (µs) | P99 (µs) | P999 (µs) | P9999 (µs) |
|---|---|---|---|---|---|
| 49 | 16 | 19 | 32 | 39 | 279 |
| 95 | 17 | 23 | 34 | 44 | 159 |
| 140 | 19 | 28 | 39 | 51 | 196 |
| 182 | 24 | 36 | 50 | 67 | 672 |
| 222 | 35 | 51 | 66 | 90 | 301 |
| 241 | 44 | 68 | 98 | 187 | 389 |
| 250 | 110 | 175 | 218 | 285 | 484 |
| 278 | 227 | 311 | 364 | 432 | 1159 |
| 296 | 323 | 472 | 583 | 872 | 3156 |
| 318 | 454 | 702 | 1042 | 43660 | 74969 |
| 323 | 460 | 685 | 958 | 13824 | 25034 |
| 330 | 588 | 878 | 24964 | 61522 | 72041 |
| 336 | 504 | 750 | 989 | 68963 | 94226 |
| 321 ⚠️ | 2067 | 4957 | 13845 | 23667 | 31281 |
⚠ 3K = frequent overloads, inbound requests thrown out by Ember's flow control mechanism (as was shown by Inbound Failed Offers metric).
Analysis
Latency is flat and well-behaved up to ~220–240K rps, with all percentiles staying in double-digit microseconds. The knee clearly appears around ~250K rps: P50 jumps ~3×, and tail percentiles (P99/P999) begin accelerating faster than linearly—classic queueing onset. Beyond ~280–300K rps tail latency explodes (P999 → tens of milliseconds at 318K), while median continues to degrade more smoothly. Practical operating envelope is ≤ ~230–240K rps if tight tail latency SLAs matter.
In this specific case full OMS throughput was twice as much as order request rate. For each order request matching engine would issue some kind of ACK event (which was recorded by OMS and sent to order request origin - FIX client bots in this case).
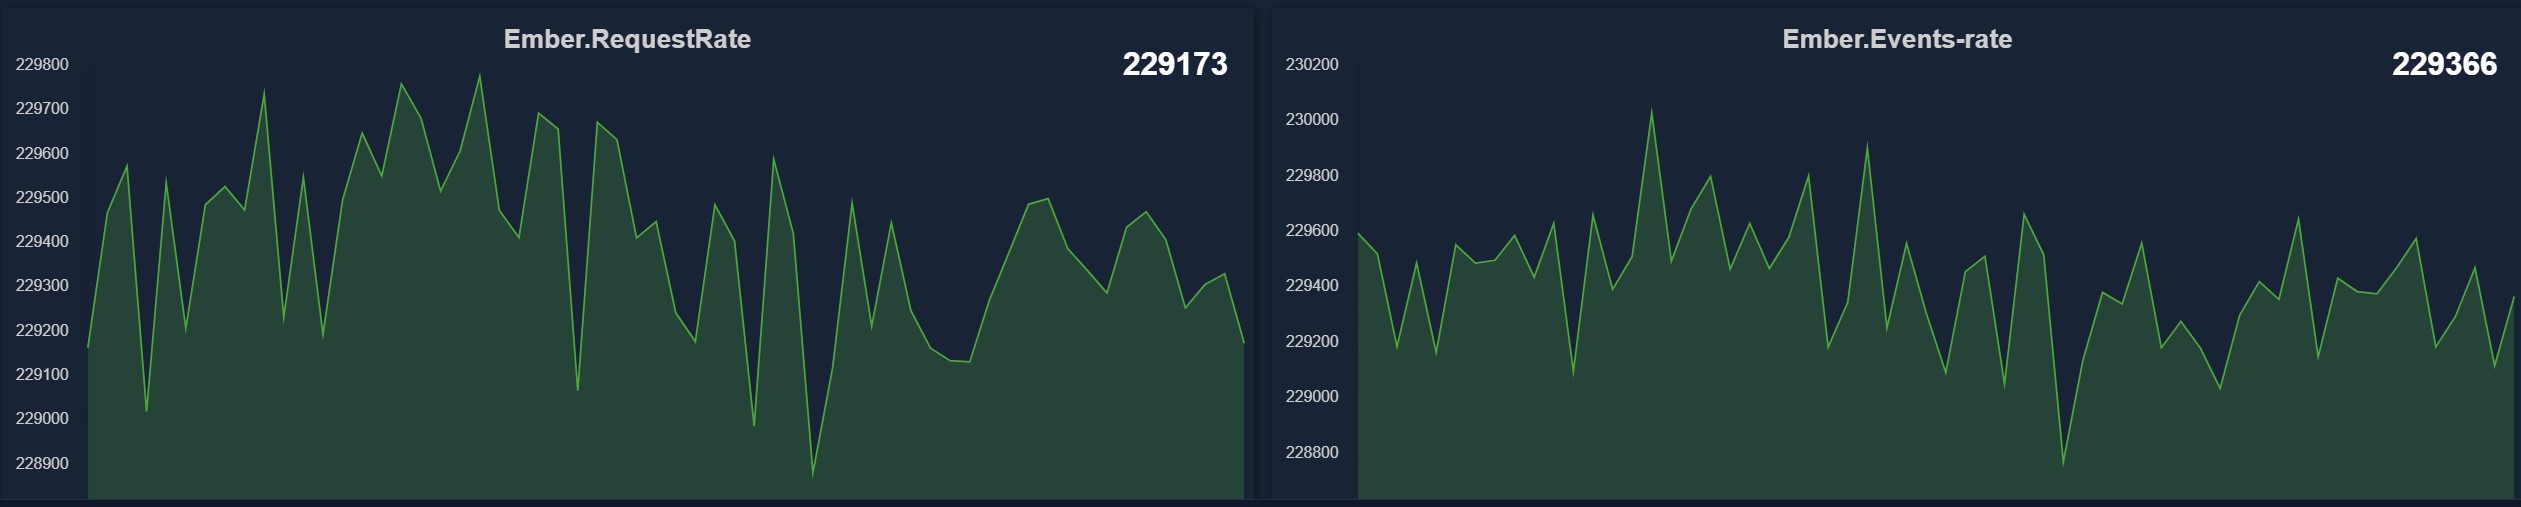
Bottom line: This test shows that system is capable of sustaining request rates up to 650,000 messages per second, as confirmed by long-duration stability tests. In addition, like any event-processing system, Ember benefits from elasticity provided by multiple internal queues. By tuning queue sizes, the system can absorb higher short-term rate spikes (lasting seconds to minutes) without degradation.
Appendix: raw test results
24th of December 2025
1000x10x5 = 49K rps

Percentile : Microseconds : Event count
MIN        :         12.0 :         686
50.0%      :         16.0 :      509255
90.0%      :         19.0 :      715793
99.0%      :         32.0 :      782946
99.9%      :         39.0 :      789393
99.99%     :        279.0 :      790059
99.999%    :       7232.0 :      790130
99.9999%   :       9032.0 :      790137
99.99999%  :       9928.0 :      790138
99.999999% :       9928.0 :      790138
MAX, TOTAL :       9928.0 :      790138


2000x10x5 = 95K

Percentile : Microseconds : Event count
MIN        :         12.0 :         581
50.0%      :         17.0 :      811180
90.0%      :         23.0 :     1379984
99.0%      :         34.0 :     1515340
99.9%      :         44.0 :     1528534
99.99%     :        159.0 :     1529796
99.999%    :        492.0 :     1529934
99.9999%   :        527.0 :     1529948
99.99999%  :        601.0 :     1529949
99.999999% :        601.0 :     1529949
MAX, TOTAL :        601.0 :     1529949


3000x10x5 = 140K

Percentile : Microseconds : Event count
MIN        :         11.0 :           4
50.0%      :         19.0 :     1192471
90.0%      :         28.0 :     2048601
99.0%      :         39.0 :     2241201
99.9%      :         51.0 :     2260874
99.99%     :        196.0 :     2262791
99.999%    :       1045.0 :     2262995
99.9999%   :       1166.0 :     2263014
99.99999%  :       1558.0 :     2263016
99.999999% :       1558.0 :     2263016
MAX, TOTAL :       1558.0 :     2263016

4000x10x5 = 182K

Percentile : Microseconds : Event count
MIN        :         11.0 :           2
50.0%      :         24.0 :     1486039
90.0%      :         36.0 :     2662489
99.0%      :         50.0 :     2930855
99.9%      :         67.0 :     2954655
99.99%     :        672.0 :     2957126
99.999%    :      37580.0 :     2957391
99.9999%   :      38664.0 :     2957418
99.99999%  :      38862.0 :     2957421
99.999999% :      38862.0 :     2957421
MAX, TOTAL :      38862.0 :     2957421


5000x10x5 = 222K

Percentile : Microseconds : Event count
MIN        :         12.0 :           3
50.0%      :         35.0 :     1909951
90.0%      :         51.0 :     3307358
99.0%      :         66.0 :     3602701
99.9%      :         90.0 :     3633499
99.99%     :        301.0 :     3636663
99.999%    :       1674.0 :     3636991
99.9999%   :       2145.0 :     3637021
99.99999%  :       2374.0 :     3637025
99.999999% :       2374.0 :     3637025
MAX, TOTAL :       2374.0 :     3637025


5500x10x5 = 241K

Percentile : Microseconds : Event count
MIN        :         13.0 :           5
50.0%      :         44.0 :     2054369
90.0%      :         68.0 :     3567841
99.0%      :         98.0 :     3891626
99.9%      :        187.0 :     3926050
99.99%     :        389.0 :     3929550
99.999%    :       1850.0 :     3929903
99.9999%   :       6718.0 :     3929938
99.99999%  :       6882.0 :     3929942
99.999999% :       6882.0 :     3929942
MAX, TOTAL :       6882.0 :     3929942


6000x10x5 = 250K

Percentile : Microseconds : Event count
MIN        :         13.0 :           1
50.0%      :        110.0 :     2032472
90.0%      :        175.0 :     3663775
99.0%      :        218.0 :     4016022
99.9%      :        285.0 :     4052289
99.99%     :        484.0 :     4055915
99.999%    :       2649.0 :     4056278
99.9999%   :       6070.0 :     4056315
99.99999%  :       7450.0 :     4056319
99.999999% :       7450.0 :     4056319
MAX, TOTAL :       7450.0 :     4056319


6500x10x5 = 278K

Percentile : Microseconds : Event count
MIN        :         14.0 :           2
50.0%      :        227.0 :     2191879
90.0%      :        311.0 :     3932249
99.0%      :        364.0 :     4314128
99.9%      :        432.0 :     4353127
99.99%     :       1159.0 :     4356902
99.999%    :       5049.0 :     4357294
99.9999%   :       6969.0 :     4357334
99.99999%  :       7180.0 :     4357338
99.999999% :       7180.0 :     4357338
MAX, TOTAL :       7180.0 :     4357338

7000x10x5 = 296K

Percentile : Microseconds : Event count
MIN        :         32.0 :           1
50.0%      :        323.0 :     2408109
90.0%      :        472.0 :     4318395
99.0%      :        583.0 :     4746509
99.9%      :        872.0 :     4789480
99.99%     :       3156.0 :     4793779
99.999%    :       5988.0 :     4794209
99.9999%   :       7594.0 :     4794252
99.99999%  :       7709.0 :     4794257
99.999999% :       7709.0 :     4794257
MAX, TOTAL :       7709.0 :     4794257

7500x10x5 = 318K

Percentile : Microseconds : Event count
MIN        :         33.0 :           1
50.0%      :        454.0 :     2566896
90.0%      :        702.0 :     4622401
99.0%      :       1042.0 :     5081794
99.9%      :      43660.0 :     5127816
99.99%     :      74969.0 :     5132436
99.999%    :      78052.0 :     5132898
99.9999%   :      78678.0 :     5132944
99.99999%  :      78876.0 :     5132948
99.999999% :      79019.0 :     5132949
MAX, TOTAL :      79019.0 :     5132949

8000x10x5 = 323K

Percentile : Microseconds : Event count
MIN        :         17.0 :           1
50.0%      :        460.0 :     2626594
90.0%      :        685.0 :     4709495
99.0%      :        958.0 :     5179523
99.9%      :      13824.0 :     5226441
99.99%     :      25034.0 :     5231151
99.999%    :      30637.0 :     5231621
99.9999%   :      31377.0 :     5231668
99.99999%  :      31439.0 :     5231672
99.999999% :      31481.0 :     5231673
MAX, TOTAL :      31481.0 :     5231673

8500x10x5 = 330K

Percentile : Microseconds : Event count
MIN        :         63.0 :           1
50.0%      :        588.0 :     2679012
90.0%      :        878.0 :     4821939
99.0%      :      24964.0 :     5303093
99.9%      :      61522.0 :     5351303
99.99%     :      72041.0 :     5356124
99.999%    :      72668.0 :     5356605
99.9999%   :      72869.0 :     5356654
99.99999%  :      73100.0 :     5356658
99.999999% :      73389.0 :     5356659
MAX, TOTAL :      73389.0 :     5356659

9000x10x5 = 336K

Percentile : Microseconds : Event count
MIN        :         27.0 :           1
50.0%      :        504.0 :     2747646
90.0%      :        750.0 :     4927361
99.0%      :        989.0 :     5417394
99.9%      :      68963.0 :     5466520
99.99%     :      94226.0 :     5471445
99.999%    :      96933.0 :     5471937
99.9999%   :      97221.0 :     5471987
99.99999%  :      97337.0 :     5471991
99.999999% :      97398.0 :     5471992
MAX, TOTAL :      97398.0 :     5471992

9500x10x5 = 321K Overload!

Percentile : Microseconds : Event count
MIN        :         43.0 :           1
50.0%      :       2067.0 :      280710
90.0%      :       4957.0 :      505128
99.0%      :      13845.0 :      555635
99.9%      :      23667.0 :      560686
99.99%     :      31281.0 :      561191
99.999%    :      35730.0 :      561241
99.9999%   :      36161.0 :      561246
99.99999%  :      36296.0 :      561247
99.999999% :      36296.0 :      561247
MAX, TOTAL :      36296.0 :      561247
September 2025
Latency at 125K order requests per second:
==========================================

Percentile : Microseconds : Event count
MIN        :         12.0 :         438
50.0%      :         20.0 :     2959876
90.0%      :         27.0 :     4706027
99.0%      :         35.0 :     5072137
99.9%      :         50.0 :     5110284
99.99%     :        314.0 :     5114737
99.999%    :        677.0 :     5115198
99.9999%   :        824.0 :     5115242
99.99999%  :        885.0 :     5115246
99.999999% :        923.0 :     5115247
MAX, TOTAL :        923.0 :     5115247

Latency at 165K order requests per second:
==========================================

Percentile : Microseconds : Event count
MIN        :         12.0 :           7
50.0%      :         23.0 :     2450009
90.0%      :         32.0 :     4071573
99.0%      :         42.0 :     4441421
99.9%      :         66.0 :     4478764
99.99%     :        428.0 :     4482749
99.999%    :       1033.0 :     4483152
99.9999%   :       2403.0 :     4483193
99.99999%  :       2962.0 :     4483197
99.999999% :       2962.0 :     4483197
MAX, TOTAL :       2962.0 :     4483197


Latency at 191K order requests per second:
==========================================


Percentile : Microseconds : Event count
MIN        :         13.0 :         150
50.0%      :         27.0 :     2036083
90.0%      :         40.0 :     3537017
99.0%      :         54.0 :     3862152
99.9%      :        118.0 :     3895391
99.99%     :        509.0 :     3898896
99.999%    :       2260.0 :     3899243
99.9999%   :       3459.0 :     3899278
99.99999%  :       3836.0 :     3899282
99.999999% :       3836.0 :     3899282
MAX, TOTAL :       3836.0 :     3899282


Latency at 198K order requests per second:
==========================================

Percentile : Microseconds : Event count
MIN        :         13.0 :          18
50.0%      :         30.0 :     2029909
90.0%      :         44.0 :     3633137
99.0%      :         60.0 :     3983205
99.9%      :        143.0 :     4013985
99.99%     :        572.0 :     4017592
99.999%    :       2300.0 :     4017955
99.9999%   :       3110.0 :     4017990
99.99999%  :       3353.0 :     4017994
99.999999% :       3353.0 :     4017994
MAX, TOTAL :       3353.0 :     4017994


Latency at 216K order requests per second:
==========================================

Percentile : Microseconds : Event count
MIN        :         14.0 :           1
50.0%      :        181.0 :     2212798
90.0%      :        235.0 :     3978073
99.0%      :        308.0 :     4365819
99.9%      :        391.0 :     4405314
99.99%     :       1873.0 :     4409281
99.999%    :       4130.0 :     4409678
99.9999%   :       4538.0 :     4409718
99.99999%  :       5055.0 :     4409722
99.999999% :       5055.0 :     4409722
MAX, TOTAL :       5055.0 :     4409722


Latency at 230K order requests per second:
==========================================
Percentile : Microseconds : Event count
MIN        :         14.0 :          15
50.0%      :         46.0 :     2357424
90.0%      :         72.0 :     4241452
99.0%      :         96.0 :     4646043
99.9%      :        216.0 :     4684706
99.99%     :        678.0 :     4688925
99.999%    :       4290.0 :     4689347
99.9999%   :       6484.0 :     4689389
99.99999%  :       6781.0 :     4689394
99.999999% :       6781.0 :     4689394
MAX, TOTAL :       6781.0 :     4689394


Latency at 241K order requests per second
(Warning: first signs of intermittent overload)
=============================================


Percentile : Microseconds : Event count
MIN        :         16.0 :           3
50.0%      :        178.0 :     2459486
90.0%      :        249.0 :     4420143
99.0%      :        312.0 :     4857058
99.9%      :        431.0 :     4900213
99.99%     :       2064.0 :     4904626
99.999%    :       4393.0 :     4905068
99.9999%   :       6834.0 :     4905112
99.99999%  :       8191.0 :     4905117
99.999999% :       8191.0 :     4905117
MAX, TOTAL :       8191.0 :     4905117


Latency at 250K order requests per second
=========================================
Frequent overloads


Percentile : Microseconds : Event count
MIN        :         12.0 :           1
50.0%      :        783.0 :      442776
90.0%      :       1660.0 :      795971
99.0%      :       2210.0 :      875545
99.9%      :       2503.0 :      883471
99.99%     :       3198.0 :      884267
99.999%    :       3700.0 :      884346
99.9999%   :       4152.0 :      884354
99.99999%  :       4346.0 :      884355
99.999999% :       4346.0 :      884355
MAX, TOTAL :       4346.0 :      884355